Disclaimer:
https://datachinchilla.substack.com/p/analysis-of-football-soccer-injury?showWelcome=true
This article is not intended to prove or confirm in any way that any heart related issues are caused by covid-19 vaccines. This article only exists to analyse the data and see if there is a correlation and if there’s a correlation what might be the frequency if correlation was caused by covid-19 vaccines.
There have been many headlines about athletes collapsing, dying and there are claims out there that it’s a lot more frequent during this year than you would normally expect.
Many lists have been compiled for this year with list of news articles of such cases happening.
Claims have been made that these injuries could be covid-19 vaccine related as for example myocarditis is linked to mRNA vaccines such as Pfizer and Moderna.
There’s also an abstract in American Heart Association publication by Steven Gundry with a claim that certain inflammatory markers change after taking the vaccine increasing heart disease risk over 2 times.
https://www.ahajournals.org/doi/10.1161/circ.144.suppl_1.10712
I haven’t noticed a good comparison being made with previous years so far. How can we tell whether there’s truly more heart related issues happening than previously?
I decided to go over data from https://www.transfermarkt.com
They keep track of injuries for players and they have a list of over 900,000 player profiles. Not every player has up to date profiles, but if we are lucky we can still compile something statistically significant from there. This will allow us to compare heart related injury rates compared to previous years.
I wrote a script to go over all injury pages, for all players. It took a while to crawl over 900,000 pages, but here I present the findings.
Example of a page highlighting those injuries:

Findings
The first and most obvious thing I could think of was to just compare absolute numbers. How many cases of “Heart Condition” has there been for each year?
Following that I figured I compile a list of injuries that stand out for year 2021. I will compare each injury that occurs with at least 1 out of 1,500 frequency.
I’m starting from year 2015, there were injury reports before that, but before this year count of injuries was fewer compared to latest years indicating that injuries weren’t as well tracked then.
For 2020 and 2021 there were also very many “Corona virus” and “Quarantine” listed out as injuries. For now I have filtered those to have better comparisons with previous years.
Injuries listed by year
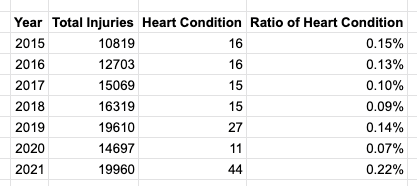
This data does indicate that heart related injuries have been much more frequent this year than any previous years. For other years besides 2021, there were 89217 total injuries counted, with 100 heart conditions. (0.11%) on average. And for 2021 there were 19912 injuries, with 44 heart conditions. This gives us p-value of 0.0012. It seems clear that there is statistical significance for this number. The question is just – what has caused it? Is it coronavirus, vaccines or something else entirely?
There’s more than 99% chance that these heart conditions are not a statistical fluke.
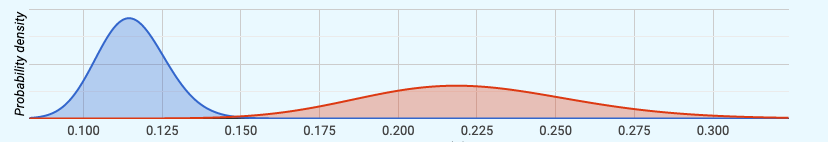
Blue = All other years, Red = 2021
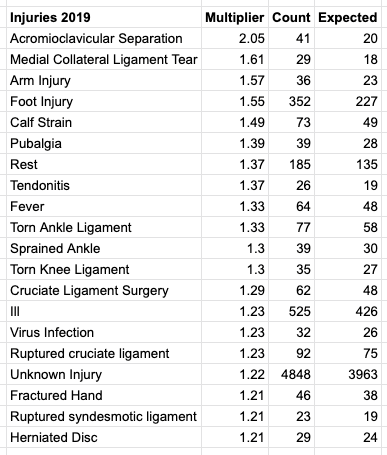
Injuries more frequent for 2021 than expected average
Injuries that have happened more frequently than 1 out of 2000 times, ordered by how much more frequently they appeared compared to average rate from all injuries. This average considers also total average per injuries counted to treat fairly years were there were fewer injuries happening. So you can see for example “Contracture” having different “Other years average” for 2021 and 2020, since 2021 simply had more injuries, and therefore would have more higher expected average.
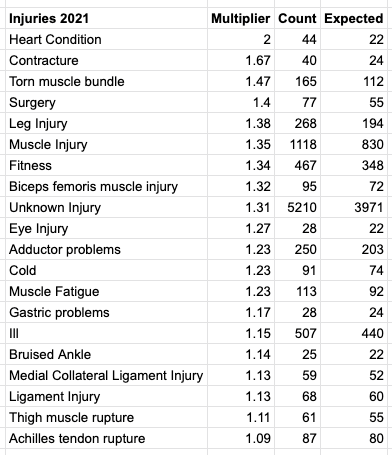
So here, heart condition also stands out for current year. Another injury that stands out is contracture, however it is unclear to me what is specifically meant by that. Contracture also stood out for 2020, but not for other years. Heart condition seems to have happened 2 times the average of other years.
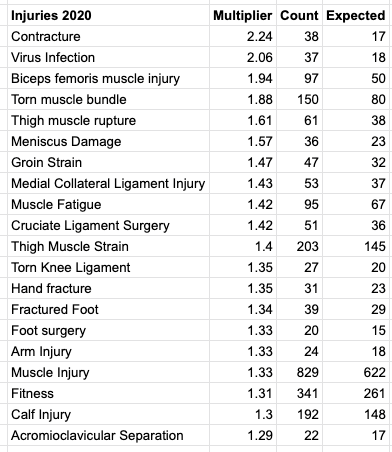
Injuries more frequent for 2020 than expected average
So contracture also stands out here, but just in case let’s also review 2019 as a comparison. It also seems that some corona virus cases, even though I removed those injuries from the list may have been classified as “Virus Infection”.
Injuries more frequent for 2019 than expected average
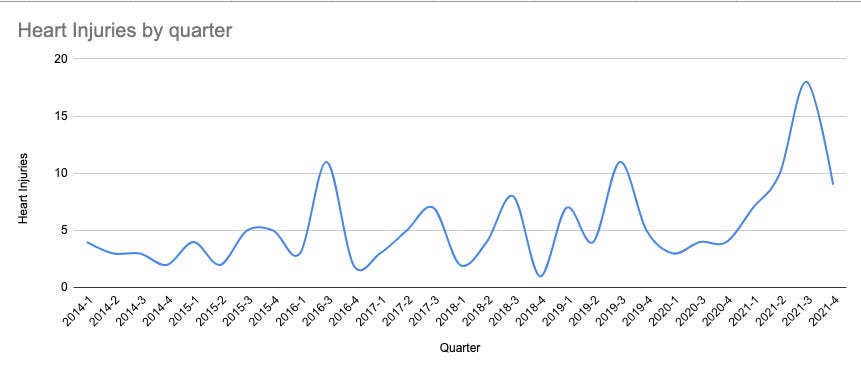
Heart condition injuries count by quarter of the year ordered
So far it’s clear that 2021 is the most popular year for heart conditions. It would also be interesting to know how they generally divide amongst the year and how they compare to other quarters. This would allow us to compare whether most heart related issues happened during high vaccination times or not. Average heart condition injuries per quarter is 5.14.
Let’s now order all the quarters since 2015. Here’s top 20 quarters laid out
So quarter 3 does seem quite a bit above other quarters, with 2nd, 4th for 2021 following.
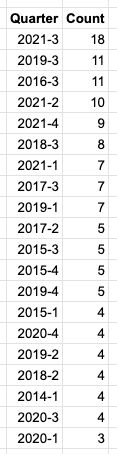
Overall this does give an impression that doesn’t rule out these heart conditions being caused by the vaccine, since Q2, Q3 and Q4 were when bulk of the vaccinations were done for athletes.
Frequency Conjecture
The following is a complete conjecture and guesswork. Since there does seem to be at least a correlation, then how frequent those incidents are? In the database I crawled over 900,000 profiles, but not all of them are active players and injuries are not tracked in great detail for lower profile players. Most players whom injuries are tracked for should have at least one injury per 2-3 seasons. I picked some news articles from lists with heart issues happening for football players in 2021, and many of them didn’t seem to have “heart condition” listed in Transfermarkt, so it seems safe to say that not all and especially lower profile player injuries are not well tracked.
I counted all players who have had any injury recorded in 19/20 or 20/21. The number is 19913. In 2021 there was 44 heart conditions which means the frequency would yield to around 1 out of 450. Excess heart conditions is 22 and if for instance we expect 70% of players to have received vaccinations, this would mean 30 heart conditions per 13939 vaccinated players. Around 1 out of 600.
Conclusion
There are more heart related issues this year for athletes than in years before according to the data recorded by Transfermarkt. If we were to assume that all excess is caused by vaccinations, it would yield to around 1 out of 600 risk of getting a heart condition from vaccination for athletes.
Limitations
- There’s lots of injuries written as “Unknown”.
- Many injuries may have not been included.
Notes of interest, questions and further research ideas
- What’s the significance of “Contracture” being more frequently reported in both 2020 and 2021? Was it just something that was a newly added classifier? Is this related to Coronavirus in any way?
- There’s many other larger injury groups that seem to happen at twice the rate. Are they simply newer classifications and are reported more for these reasons?
- Go over the injuries found case by case.
Other links of interest
- List of association footballers who died while playing
- 5 fold increase in sudden cardiac deaths of FIFA players in 2021
- Abstract 10712: Observational Findings of PULS Cardiac Test Findings for Inflammatory Markers in Patients Receiving mRNA Vaccines
- List of athlete collapses/deaths in 2021
Edits
- Fixed inflated multiplier values for injuries outstanding for each of the years.