stock here: An overall view, “I killed people because they threatened my job”. She covers many perspectives.
stock here: It was Jan. 10, 1963, that Congressman Albert S. Herlong. Jr. from Florida read the list of 45 Communist goals for America into the Congressional Record. The purpose of him reading this was to gain insight into liberal elite ideas and strategies for America that sound awfully familiar today.
1. U.S. should accept coexistence as the only alternative to atomic war.
2. U.S. should be willing to capitulate in preference to engaging in atomic war.
These encapsulate the Kennan Doctrine, which advocated for the “containment” of communism. Establishment figures supporting the amoral containment policy at least implicitly worked with the communists in scaring the wits out of the American people concerning atomic war.
President Ronald Reagan undid the doctrine when he took an aggressive stand against the Evil Empire by backing freedom fighters from around the world that were struggling against the left-wing communist jackboot. As a result, the Soviet Union and its satellites imploded, a considerable and unexpected setback to the international communist edifice.
3. Develop the illusion that total disarmament by the U.S. would be a demonstration of “moral strength.”
The nuclear freeze advocates supported a freeze on
4. Permit free trade between all nations regardless of Communist affiliation and regardless of whether or not items could be used for war.
Today, there are calls to end the embargo on the slave island of Cuba, there were complaints about the embargo against Iraq, and the U.S., not Saddam Hussein, was blamed for the suffering of the Iraqi people. Would they have advocated for free trade with Hitler and his National Socialist regime?
5. Extend long-term loans to Russia and Soviet satellites.
6. Provide American aid to all nations regardless of Communist domination.
Such aid and trade over decades contributed greatly to the left-wing communist liquidation of over 100 million people worldwide, according to the well-documented “Black Book of Communism.”
This aid and trade marks a shameful chapter in American history. Without the aid and trade, the left-wing international communist behemoth would have imploded on its own rot a lot sooner and umpteen millions would have been saved from poverty, misery, starvation and death.
7. Grant recognition of Red China and admission of Red China to the U.N.
Not only did President Jimmy Carter fulfill this goal but he also betrayed America’s allies in Nicaragua, El Salvador, Iran, Afghanistan, Angola and elsewhere.
8. Set up East and West Germany as separate states in spite of Khrushchev’s promise in 1955 to settle the Germany question by free elections under supervision of the U.N.
9. Prolong the conferences to ban atomic tests because the U.S. has agreed to suspend tests as long as negotiations are in progress.
10. Allow all Soviet satellites individual representation in the U.N.
11. Promote the U.N. as the only hope for mankind. If its charter is rewritten, demand that it be set up as a one-world government with its own independent armed forces.
There are still American intellectuals, and elected members of Congress, who dream of an eventual one world government and who view the U.N., founded by communists such as Alger Hiss, the first secretary-general, as the instrument to bring this about.
World government was also the dream of Adolf Hitler and J.V. Stalin. World government was the dream of Osama bin Laden and the 9/11 hijackers.
12. Resist any attempt to outlaw the Communist Party.
13. Do away with loyalty oaths.
14. Continue giving Russia access to the U.S. Patent Office.
While the idea of banning any political party runs contrary to notions of American freedom and liberty, notions that are the exact opposite of those held by the left-wing communists themselves, nevertheless these goals sought to undermine the constitutional obligation of Congress to investigate subversion. The weakening of our government’s ability to conduct such investigations led to the attack of 9/11.
It is entirely proper and appropriate for our government to expect employees, paid by the American taxpayer, to take an oath of loyalty.
15. Capture one or both of the political parties in the U.S.
In his book “Reagan’s War,” Peter Schweizer demonstrates the astonishing degree to which communists and communist sympathizers have penetrated the Democratic Party. In his book, Schweizer writes about the presidential election of 1979.
16. Use technical decisions of the courts to weaken basic American institutions, by claiming their activities violate civil rights.
This strategy goes back to the founding of the American Civil Liberties Union by Fabian Socialists Roger Baldwin and John Dewey and Communists William Z. Foster and Elizabeth Gurley Flynn among others.
17. Get control of the schools. Use them as transmission belts for Socialism and current Communist propaganda. Soften the curriculum. Get control of teachers associations. Put the party line in textbooks.
18. Gain control of all student newspapers.
19. Use student riots to foment public protests against programs or organizations that are under Communist attack.
The success of these goals, from a communist perspective, is obvious. Is there any doubt this is so?
20. Infiltrate the press. Get control of book review assignments, editorial writing, policy-making positions.
21. Gain control of key positions in radio, TV & motion pictures.
22. Continue discrediting American culture by degrading all form of artistic expression. An American Communist cell was told to “eliminate all good sculpture from parks and buildings,” substituting shapeless, awkward and meaningless forms.
23. Control art critics and directors of art museums. ” Our plan is to promote ugliness, repulsive, meaningless art.”
24.Eliminate all laws governing obscenity by calling them “censorship” and a violation of free speech and free press.
25. Break down cultural standards of morality by promoting pornography and obscenity in books, magazines, motion pictures, radio and TV.
26. Present homosexuality, degeneracy and promiscuity as “normal, natural and healthy.”
This is the Gramscian agenda of the “long march through the institutions” spelled out explicitly: gradual takeover of the “means of communication” and then using those vehicles to debauch the culture and weaken the will of the individual to resist.
Today those few who still have the courage to advocate public morality are denounced and viciously attacked. Most Americans are entirely unwitting regarding the motives behind this agenda.
27. Infiltrate the churches and replace revealed religion with “social” religion. Discredit the Bible and emphasize the need for intellectual maturity, which does not need a “religious crutch.”
This has been largely accomplished through the communist infiltration of the National Council of Churches, Conservative and Reform Judaism, and the Catholic seminaries.
28. Eliminate prayer or any phase of religious expression in the schools on the grounds that it violates the principle of “separation of church and state”
Replacing belief in the creator with belief in the earthly man-controlled State.
29. Discredit the American Constitution by calling it inadequate, old fashioned, out of step with modern needs, a hindrance to cooperation between nations on a worldwide basis.
And replace our nation of “laws, not men” with royal decree emanating from appointed judges and executive orders. Replace elected officials with bureaucrats.
30. Discredit the American founding fathers. Present them as selfish aristocrats who had no concern for the “common man.”
31. Belittle all forms of American culture and discourage the teaching of American history on the ground that it was only a minor part of “the big picture.” Give more emphasis to Russian history since the Communists took over.
Obliterating the American past, with its antecedents in principles of freedom, liberty and private ownership is a major goal of the communists then and now.
32. Support any socialist movement to give centralized control over any part of the culture – education, social agencies, welfare programs, mental health clinics, etc.
Public ownership of the means of production, the core principle of totalitarianism.
33. Eliminate all laws or procedures which interfere with the operation of the Communist apparatus.
34. Eliminate the House Committee on Un-American Activities.
35. Discredit and eventually dismantle the FBI.
36. Infiltrate and gain control of more unions.
37. Infiltrate and gain control of big business.
Turn America into a socialist police state.
38. Transfer some of the powers of arrest from the police to social agencies. Treat all behavioral problems as psychiatric disorders which no one but psychiatrists can understand or treat.
The Soviets used to send “social misfits” and those deemed politically incorrect to massive mental institutions called gulags. The Red Chinese call them
39. Dominate the psychiatric profession and use mental health laws as a means of gaining coercive control over those who oppose communist goals.
Psychiatry remains a bulwark of the communist agenda of fostering self-criticism and docility.
40. Discredit the family as an institution. Encourage promiscuity and easy divorce.
Done! The sovereign family is the single most powerful obstacle to authoritarian control.
41. Emphasize the need to raise children away from the negative influence of parents. Attribute prejudices, mental blocks and retarding of children to suppressive influence of parents.
Outcome-based education, values clarification or whatever they’re calling it this year.
42. Create the impression that violence and insurrection are legitimate aspects of the American tradition; that students and special interest groups should rise up and make a “united force” to solve economic, political or social problems.
This describes the dialectical fostering of group consciousness and conflict, which furthers the interests of authoritarianism.
43. Overthrow all colonial governments before native populations are ready for self-government.
The results of this successful campaign are increasingly obvious in the world today.
44. Internationalize the Panama Canal.
45. Repeal the Connally Reservation so the U.S. cannot prevent the World Court from seizing jurisdiction over domestic problems. Give the World Court jurisdiction over domestic problems. Give the World Court jurisdiction over nations and individuals alike.
This would mark a complete subversion of our Constitution and an end to representative sovereign government as we know it, which is the whole idea.
News, opinion, and entertainment for people who love the American way of life.
Viral video captures woman defecating on car over road rage incident
Settlement ‘in principl’ reached in $30 million Ashli Babbitt wrongful death lawsuit
Trump’s DOJ files lawsuit against Illinois for restricting program meant to bar illegal alien workers
Load More
Terms of UsePrivacy PolicyCalifornia Privacy NoticeDo Not Sell or Share My Personal Information
© 2025 Blaze Media LLC. All rights reserved.
Get the stories that matter most delivered directly to your inbox.
https://link.theblaze.com/join/3ia/blazemedia-rm-footer
By signing up, you agree to our Privacy Policy and Terms of Use, and agree to receive content that may sometimes include advertisements. You may opt out at any time.
stock here: Fauci Took The JAB. I heard it was on video. “They” who were running this worldwide program, did not tell Fauci, but I wonder why Fauci hid the damages from the Jab? Fauci, had serious Cardio Pulmonary problems several months after his Jabs, eventually minimized as a clot in the lungs.
https://www.zerohedge.com/political/chaos-agent-anthony-fauci-represents-system-needs-be-cleansed


Categories
Kilauea Volcano, Continued to Erupt
stock here, these are live cams. Big Eruption July 28,29
How did this get by me? An Eruption of Mauna Loa 12-8-26
What happened
Mauna Loa began erupting at about 11:30 p.m. HST on November 27, 2022, initially inside its summit caldera, Mokuʻāweoweo. It was Mauna Loa’s first eruption since 1984. Within hours, activity migrated into the volcano’s Northeast Rift Zone, where several long cracks—or fissures—opened.
Most of the eruption eventually concentrated at Fissure 3. That vent produced:
- Pulsating lava fountains
- A growing spatter and cinder cone
- Fast-moving channelized lava near the vent
- Broad, rough ʻaʻā lava flows farther downhill
The main flow traveled northward and approached Saddle Road, causing considerable concern because that highway is the principal cross-island route between Hilo and Kona. The flow front eventually stalled about 1.7 miles—2.8 km—from the highway.
What was happening on December 8
By the morning of December 8, the magma supply had dropped sharply. Fissure 3 was still erupting, but the fountains and lava output were diminishing. New lava was mostly spilling around the vent and traveling no farther than about 2.5 miles—4 km—from Fissure 3. The older downhill channels were draining and were no longer effectively feeding the distant flow front.
So the stream may look extremely violent close to the vent, but by then the eruption was actually winding down. Mauna Loa stopped erupting on December 10, 2022. The lava crossed and buried part of Mauna Loa Observatory Road but did not reach Saddle Road or populated communities
Categories
Lindsey Graham, Evil?
stock here: I was surprised at the out pouring of support for Lindsey Graham. Of course, he was gay. And a war monger. But was he evil?
Lindsey Graham was absolutely evil. Watching this gave me the creeps. pic.twitter.com/2AwHqE7Mbz
— Senex (@senex_official) July 26, 2026
Marjorie Taylor Greene just delivered the most honest eulogy Lindsey Graham's legacy deserved:
— Ounka (@OunkaOnX) July 15, 2026
"Lindsey Graham was a neo-con warmonger. A murderer. He wanted to wipe out innocent people in Iran, Gaza, Lebanon. He was a dedicated Zionist. He was the greatest lobbyist the military… pic.twitter.com/7NsVB94igz
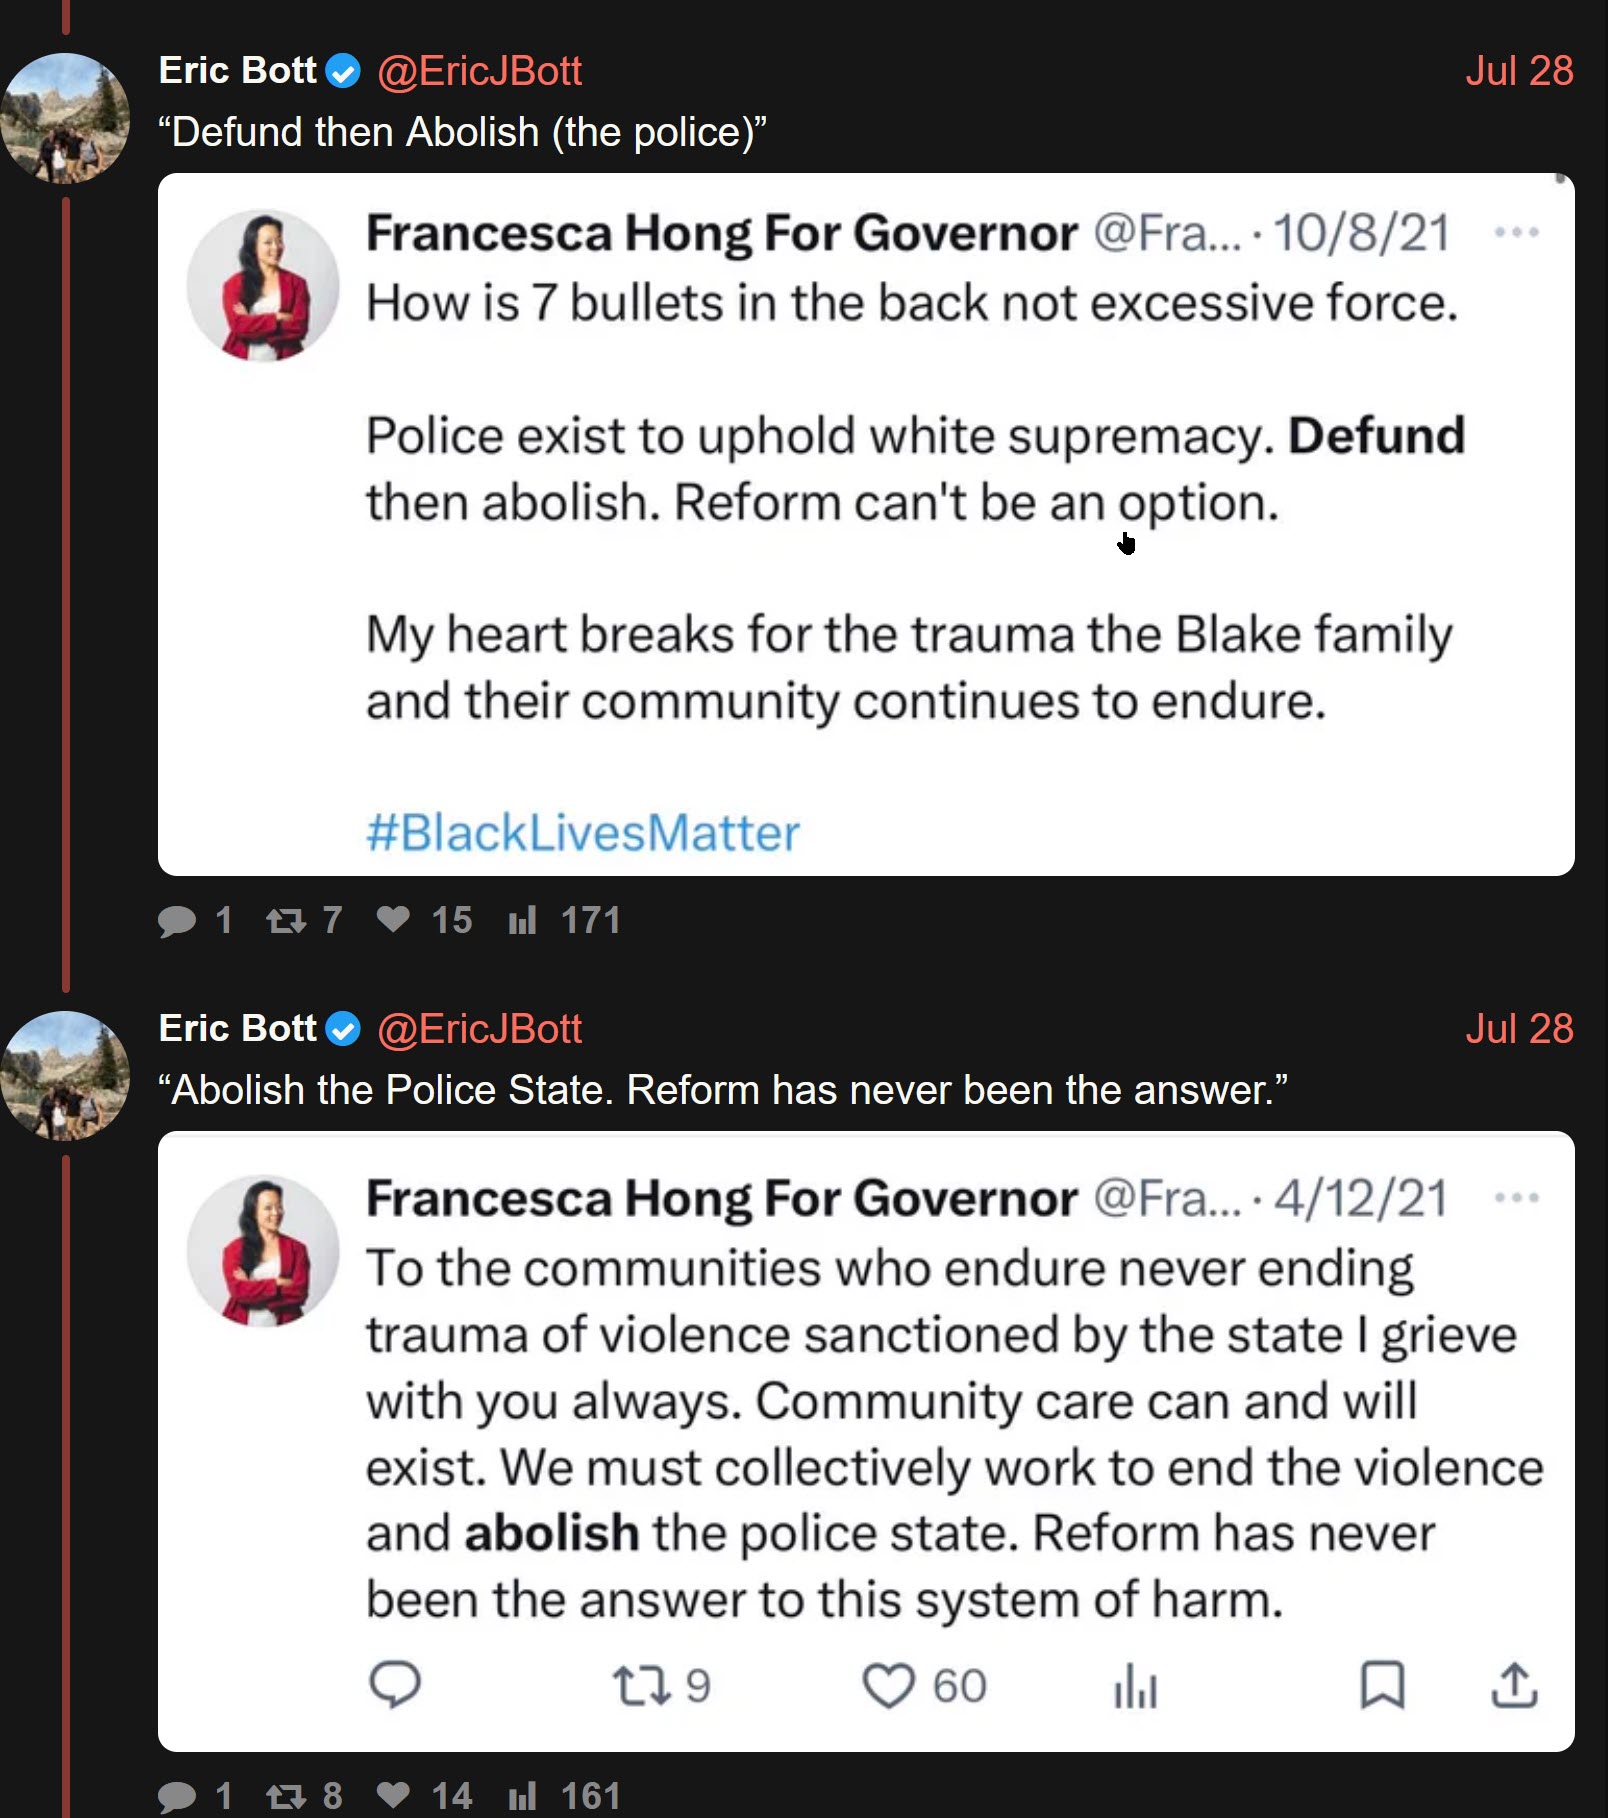
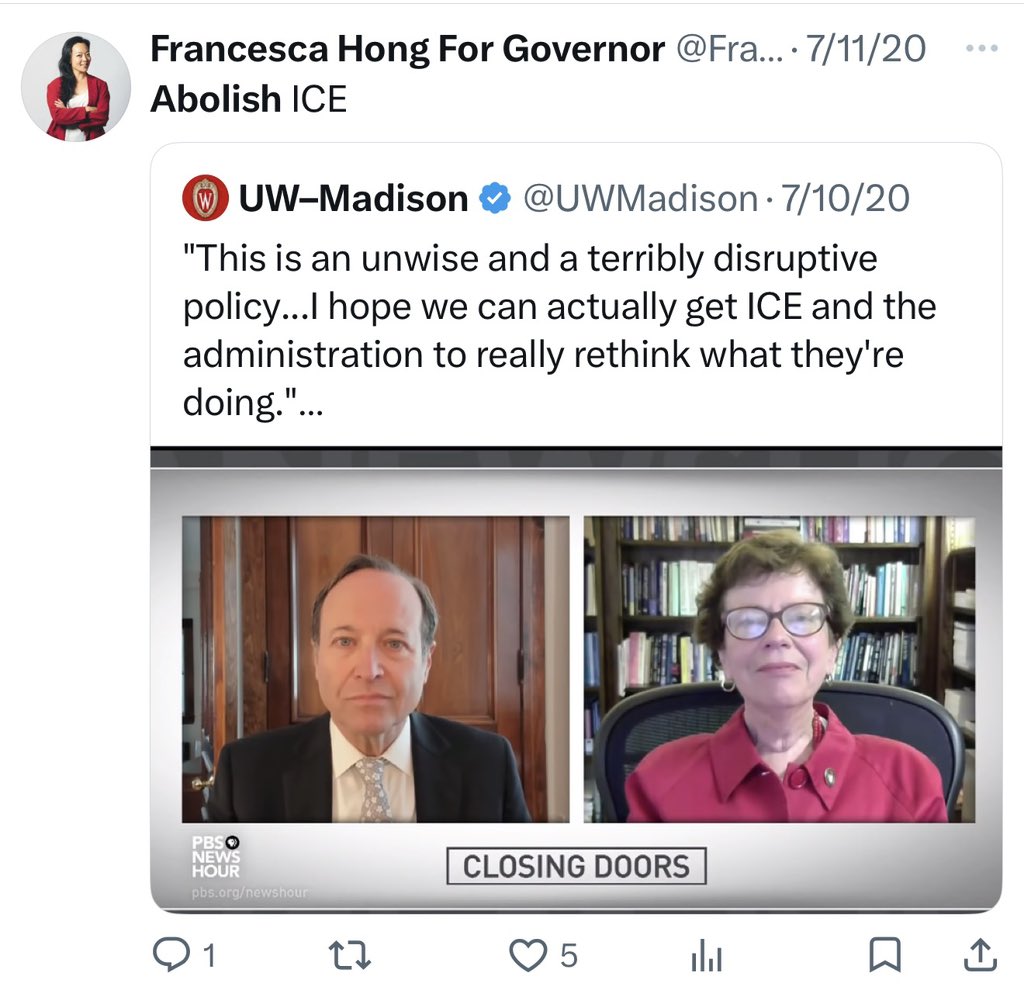
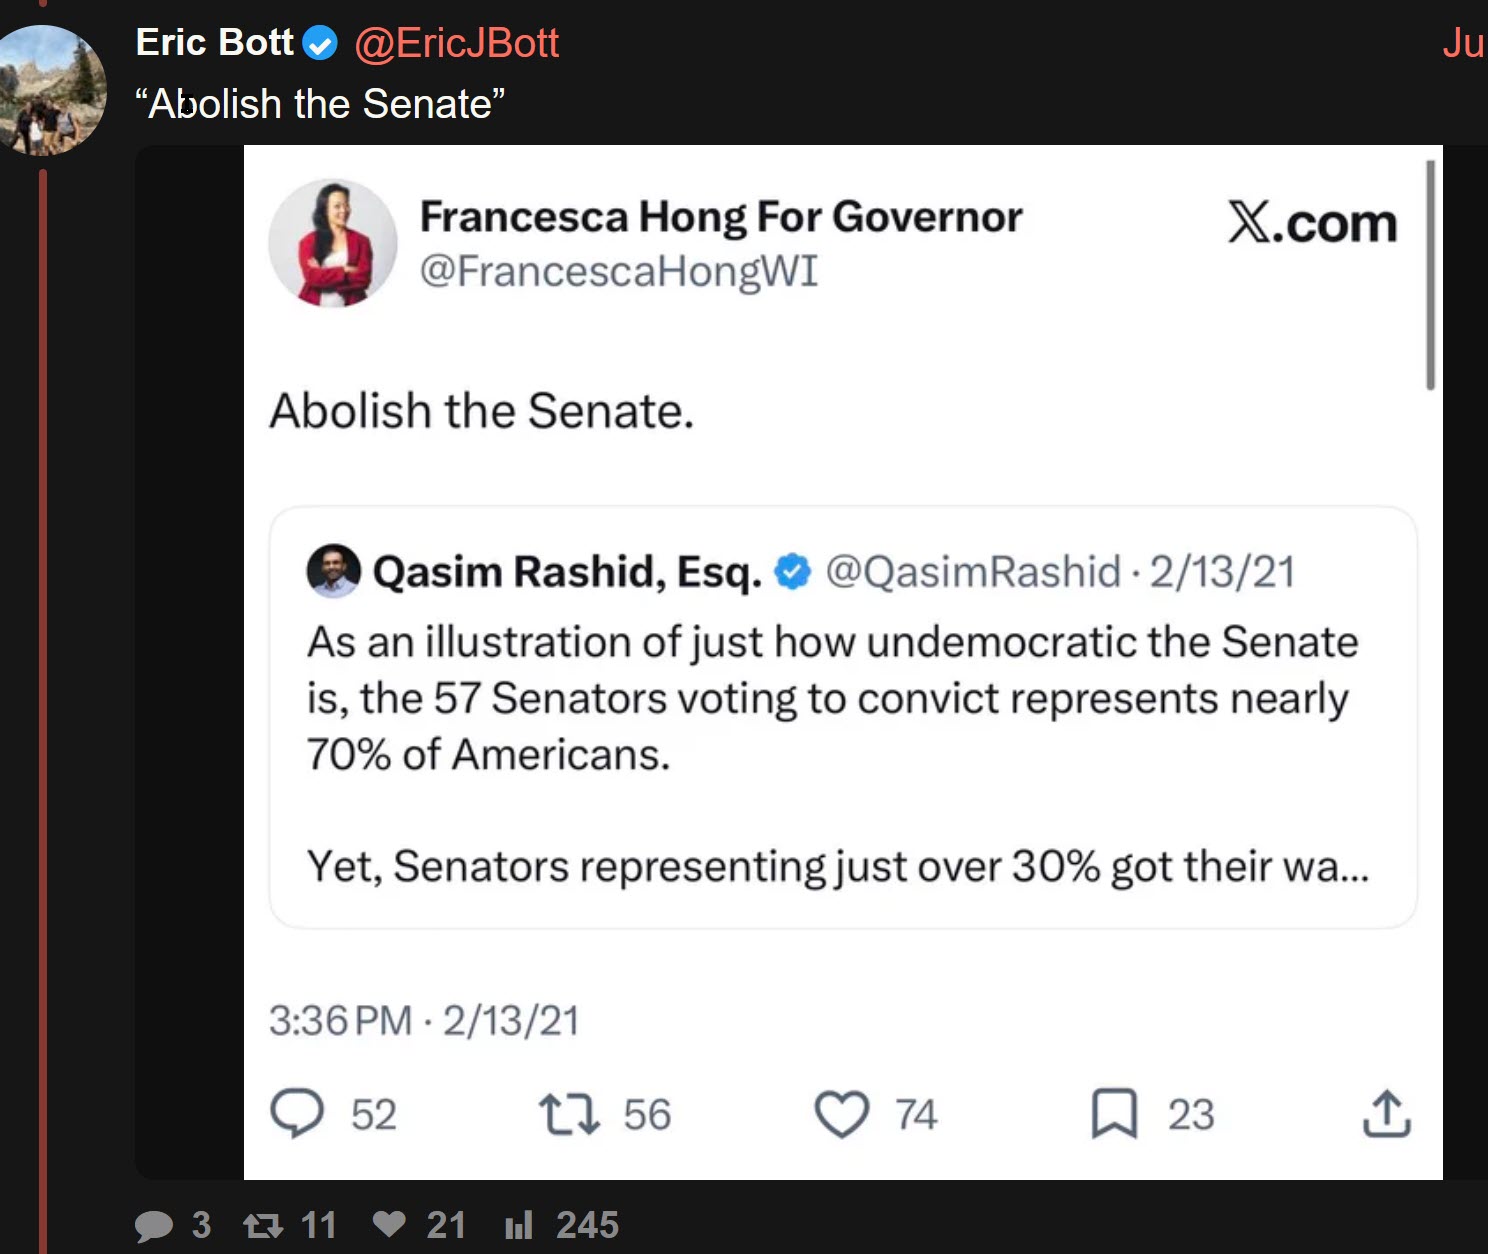
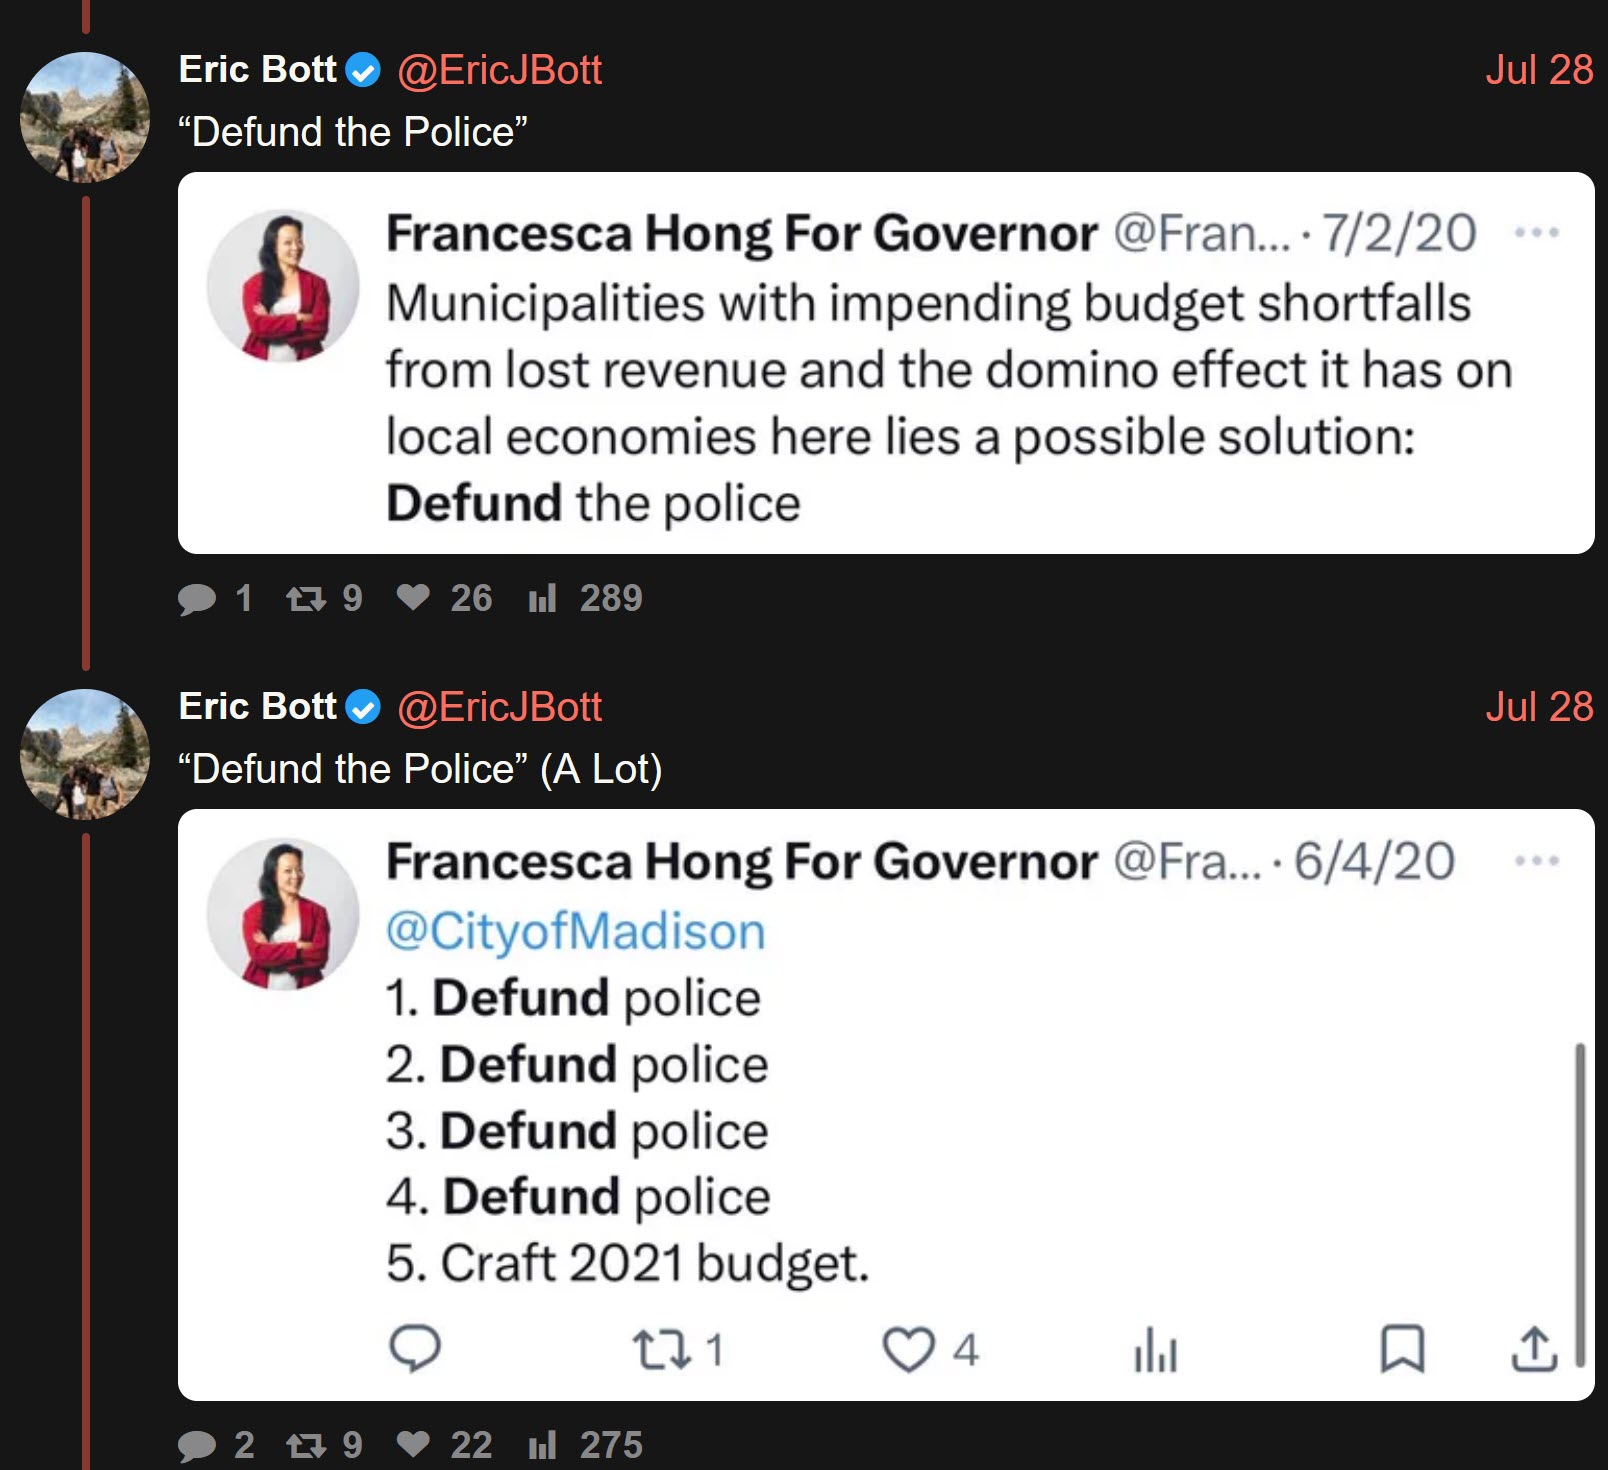
stock here: This is astounding, Wisconsin goes down with barely a fight. Spoiler alert, she is a bartender like AOC.
Francesca also sounds like the perfect Marxist / Community Organizer name. This link is from a different story, about her now saying the opposite of what she has been saying for years.


Categories
Laura Aboli — 2023 Trans-Humanism
stock here: seen this before, but she is so spot on.
stock here: “They” Always try to erase our best history, and pretend they didn’t do the things they did. Curious how Birx is so blurry in this video.

Dr. Deborah Birx served about 25 years as a physician and medical researcher in the U.S. Army, retiring with the rank of colonel.
Her work was primarily biomedical rather than combat-related. She conducted HIV/AIDS and vaccine research and later directed the U.S. Military HIV Research Program at the Walter Reed Army Institute of Research. She received military honors including the Legion of Merit and Meritorious Service Medals.
stock here: we shall see how this plays out. I sense it being horrible.
At least he is calling Palestine, Palestine, unless that j$$ comedian who said “doesn’t exist”. Seinfeld. Shame on him.
This is the last post before 10 years of Nukepro was censored from the Web.
You know you are over the target when they attack with force and speed, and no discussion, no review even though I requested a review.
————————————————————
 These are from a prior article, right click and open for a large view.


You will need to open the Excel spreadsheet to truly comprehend that there are 100’s of experiments being carried out under the guise of “Vaccines”.
Its a huge file, over 20MB and has all the Data Related to Death in the VAERS system, well the parts that haven’t been scrubbed.
https://app.box.com/s/5zcnczeyati2lq4u66s8vc55rbclgo2t
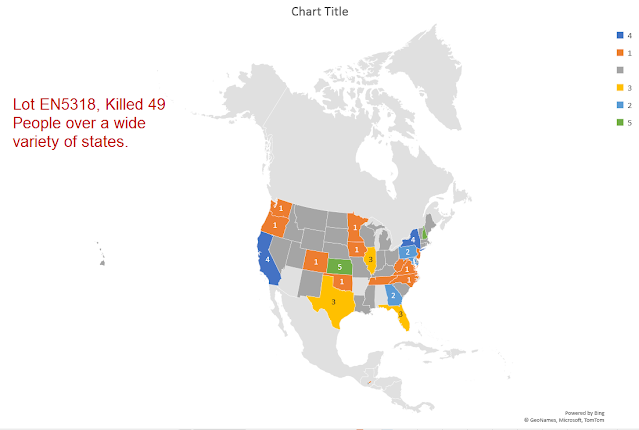
I analyzed by Lot / Batch and by US State. Seems odd to ship a single batch all over the country? Unless of course you wanted to test a bio-Weapon upon different populations to see how they work on that population.
And what if you wanted to make Red States more infertile, more quickly? After results from the first tranche of VXX come in, you would know exactly how to do it most effectively.

First chart, number of deaths is high in States that are swing states.
Second chart, percentage of deaths is high in independent “Trump States”


stock here: Was he cremated to further destroy the evidence.
stock here: I have been pondering this strange wording “Data Centers” that somehow need massive energy. I still don’t have the answers.
Consider This:
stock here: he farms 100 acres, Amish style, no electricity at his house and farm.
Semi-Fake Yogurts, most have way too much sugar. Activia have real pro-biotics, but also added sugar.
Oh my, fake Mayonnaise too! Primal Kitchen Avocado Oil, no seed oils….
stock here: the real meat of this story is in the second half, supposed to be able to get it for free (at least 1 time), but I have tried everything.
In the shadows of modern history, a troubling transformation is unfolding across the United States and Europe. Waves of migrants from the Third World—places marked by poverty, instability, and cultural dissonance—pour across borders, reshaping the demographic fabric of Western nations at an alarming pace.
To the untrained eye, this might seem like a chaotic, organic process, driven by war or economic desperation. But to those paying closer attention, a more sinister pattern emerges: the fingerprints of Jewish groups, wielding influence through advocacy, funding, and political maneuvering, are all over this mass migration phenomenon.
From the halls of power to the resettlement camps, their role in accelerating this flood of newcomers cannot be ignored.
For those of us who fear the replacement of native populations—our cultures, our identities, our very existence—this is no mere coincidence. It’s a conspiracy hiding in plain sight.
This article will peel back the layers of this unsettling reality, exposing the historical roots, the key players, the staggering statistics, and the devastating impacts on native populations.
We won’t waste time guessing at their reasons—those are buried in whispers and speculation. Instead, we’ll focus on what’s undeniable: the actions they’ve taken and the outcomes they’ve wrought.
Brace yourself for a journey into a world where population replacement isn’t just a theory—it’s a calculated operation, and Jewish groups are at its helm.
stock here: I bet they weren’t even evil enough to expect this effect, from the ritual abuse.
A total of 33 729 pregnant women participated in the BRFSS and provided information on past-month alcohol use. The adjusted prevalence of current alcohol use increased from a low of 9.1% (95% CI, 7.8%-10.4%) in 2011-2012 to a high of 15.2% (95% CI, 13.2%-17.2%) in 2021-2022, before decreasing slightly to 14.5% (95% CI, 12.3%-16.7%) in 2023-2024 (prevalence ratio [PR], 1.59 [95% CI, 1.29-1.96]; Figure).
Binge and heavy drinking followed similar patterns, reaching prevalence rates of 4.6% (95% CI, 3.6%-5.7%) (PR, 1.77 [95% CI, 1.26-2.49]) and 2.0% (95% CI, 1.1%-2.8%) (PR, 2.66 [95% CI, 1.50-4.72]), respectively, by 2023-2024.
In adjusted trend models, successive 2-year periods were associated with higher odds of current alcohol use (odds ratio [OR], 1.10 [95% CI, 1.06-1.13]), binge drinking (OR, 1.12 [95% CI, 1.07-1.17]), and heavy drinking (OR, 1.16 [95% CI, 1.08-1.24]) in the past month, indicating statistically significant increases over the time frame (Figure).

Categories
Jade_Dragon Speaks Great Truths
from ZH:
Arguably if Zionists control banking, entertainment, and media they’re a far more formidable adversary than Muslims. To any Judeo-Christian Americans who may be reading this, you’ve been sold a bill of goods. Sending your tithes to Israel so they can build synagogues on top of Christian churches? Shame on you.
.
Dom is correct. Who owns MSM: the ChiComs? Leftist bluehairs?? Where does all this FILTH emanate from?
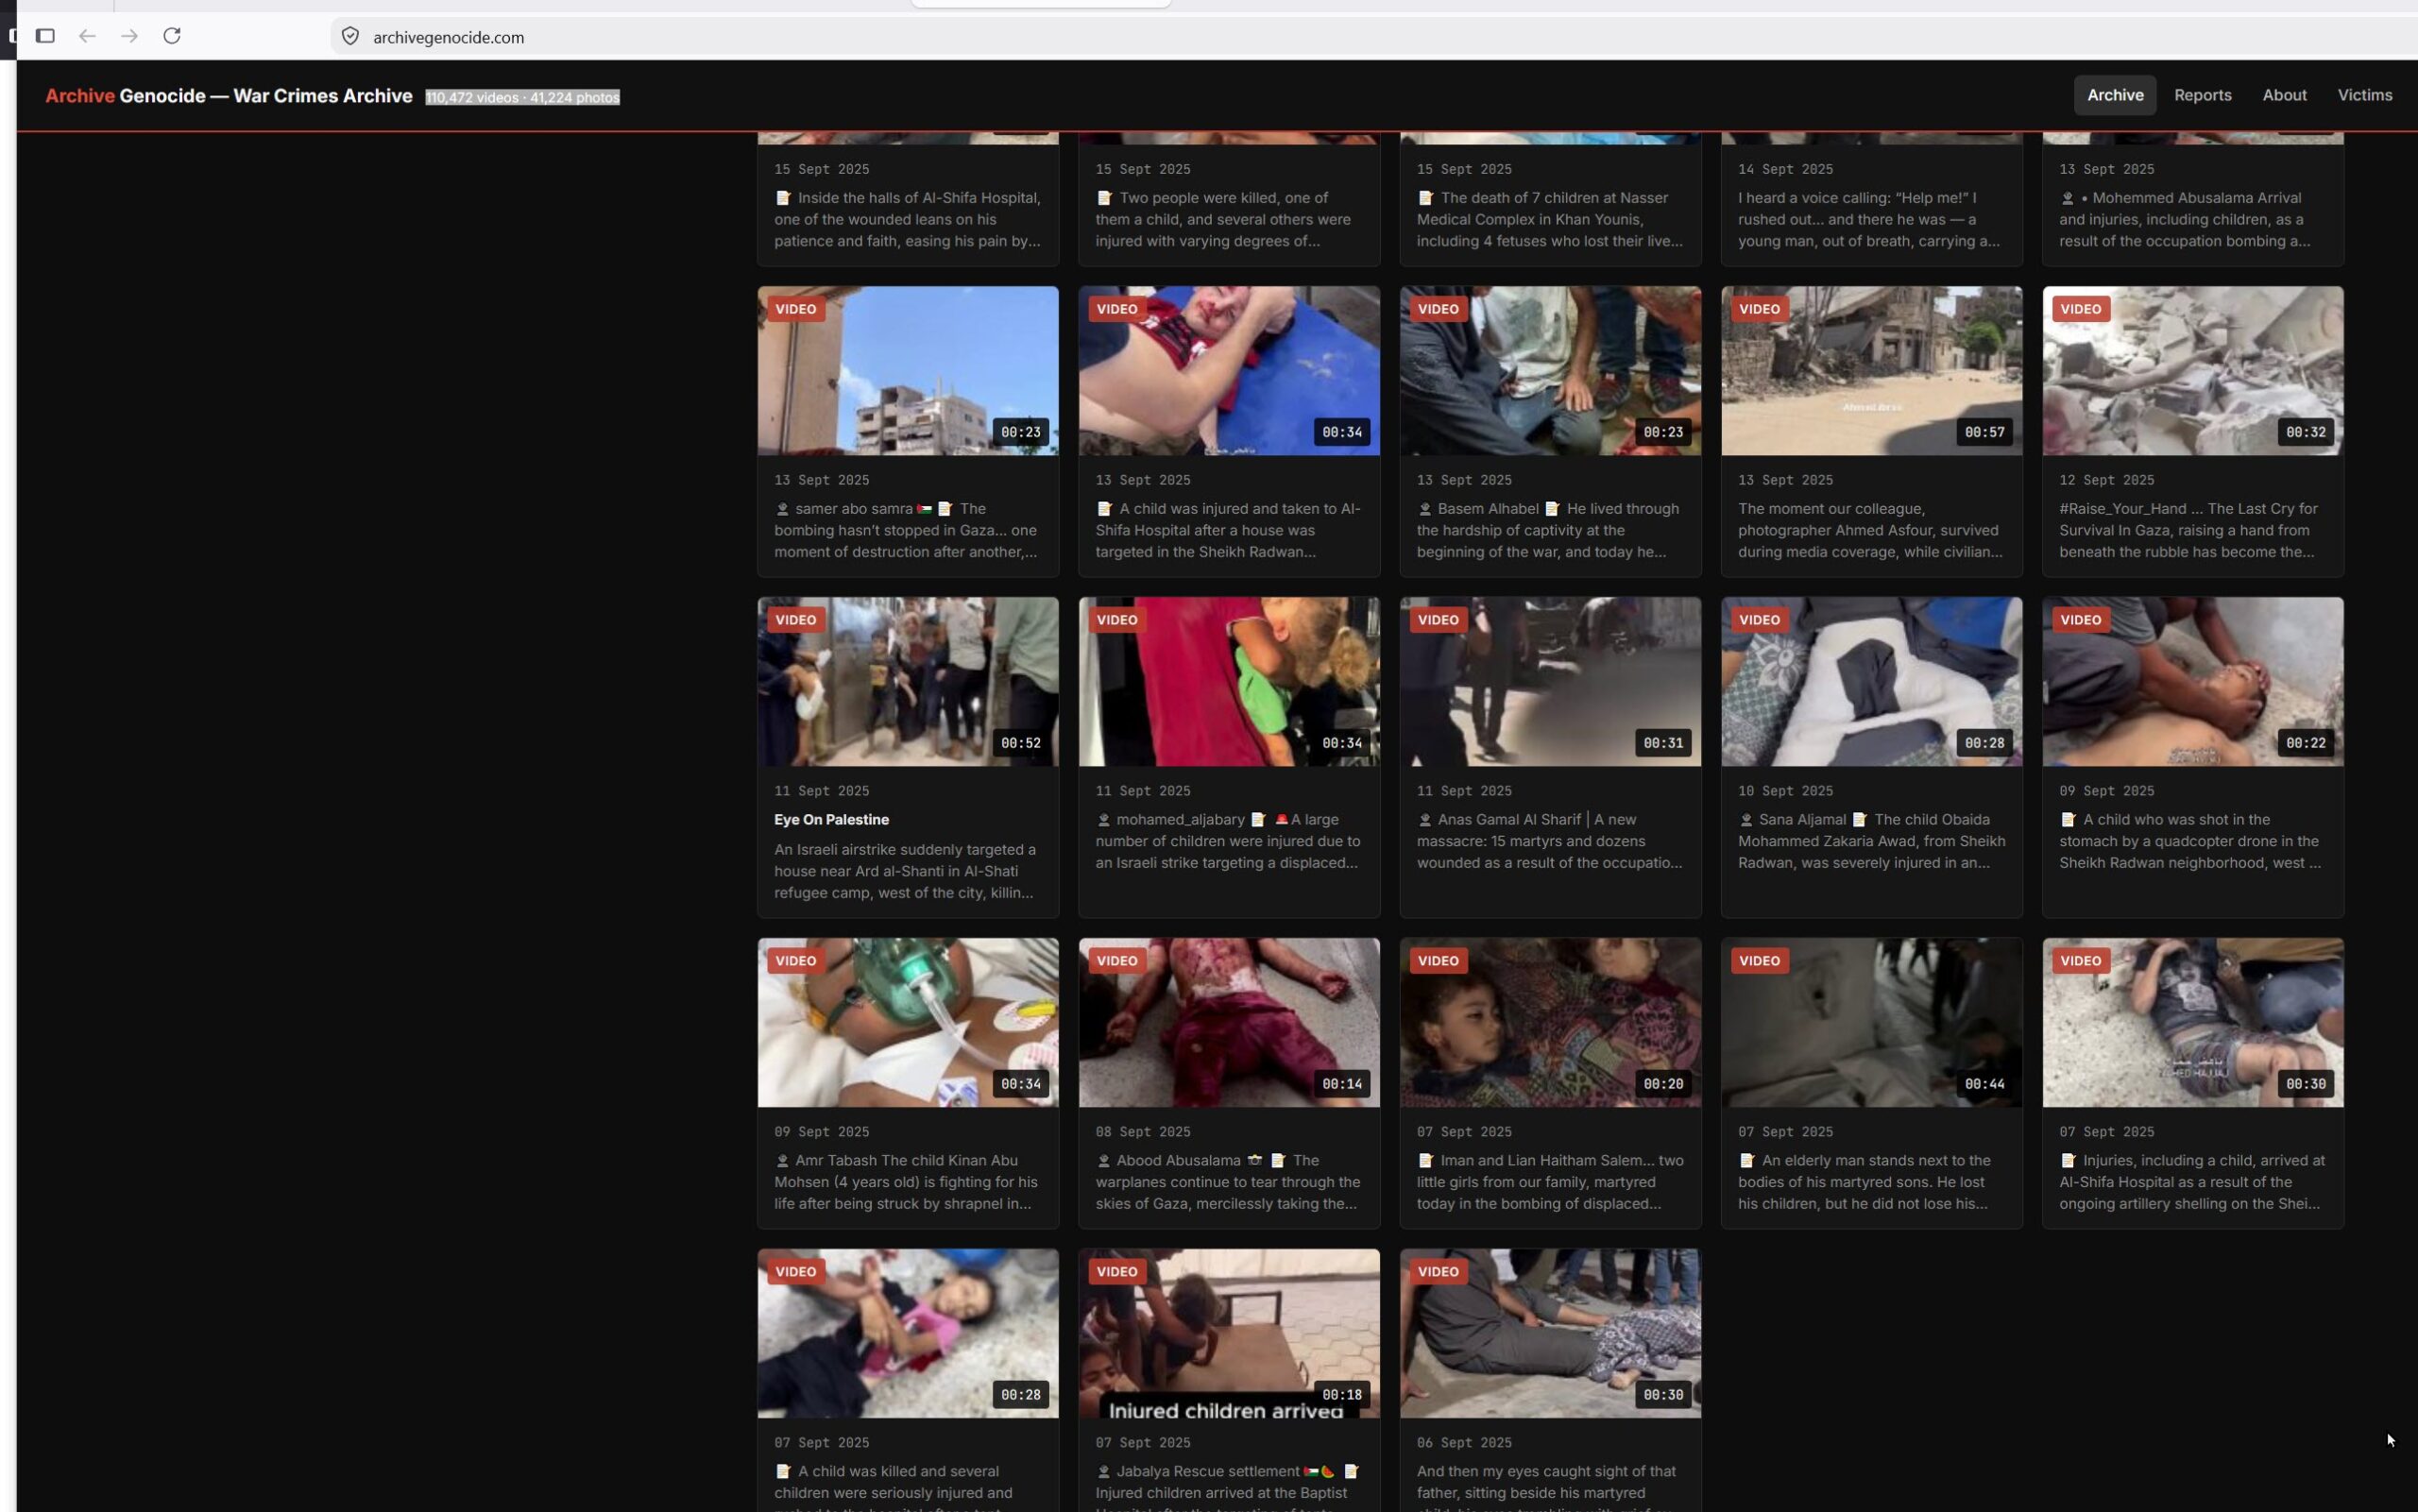
stock here: I haven’t seen any site like this until today. I knew it must exist. The genocide looks far worse than Warsaw Poland WW2.
stock here: Another “news org” that seems compromised. The new Hero is weak and emasculated, by this very article. And the Transgender member, who was never part of the original Homer, and Helen of Troy played by a black (female at least, LOL)
I’ll be missing this one.
Commentary
It’s the fourth-largest box office money maker in history for an R-rated film’s first week. It scored a 94 percent approval rating from film critics and a 97 percent approval rating from audience members on Rotten Tomatoes. Tickets for its IMAX premiere sold out a year in advance, with scalpers getting more than $1,000 for $35 tickets. By all accounts, it is a blockbuster of epic proportions (pun intended). I’m talking about Christopher Nolan’s “The Odyssey,” of course, the movie everyone has been talking about since (and before) its official opening on July 17.
The praise heaped upon “The Odyssey” seems, for the most part, genuine and thoughtful. Okay, loving the film because Matt Damon plays Odysseus is pedestrian, but enjoying the cinematography, the effects (Nolan famously refuses to use CGI unless absolutely necessary), the ambitious score by Ludwig Göransson, and the film’s size and scope (said to properly befit an epic) are all legitimate criteria for evaluating the worth of a film.
Story continues below advertisement
Despite all the positive reviews, “The Odyssey” is not without its detractors, and I think their pushback has merit. Some audience members have complained that the film, at just less than three hours, is overly long and that there have been accounts of patrons leaving the theater, unable to overcome boredom. I file this under “You Can’t Please Everyone.” More thoughtful negative comments complained about the woke casting: “white armed” Helen of Troy, for example, is played by black actress Lupita Nyong’o (who has wasted no time in labeling Homer a misogynist); the anachronistic dialogue (“My dad is coming home,” Telemachus said); the Viking ships and Roman helmets; the steel armor in the Bronze Age (a character actually said, “the Age of Bronze is ending”); the exclusion of all male gods, particularly Zeus and Poseidon, central characters in Homer’s poem; and the feminist reading of the poem based on the translation by Emily Wilson.
A little more troubling is the inclusion of a character, Sinon, who does not appear in either “The Odyssey” or “The Iliad” (but you will find him in Virgil’s “Aeneid” and Dante’s “Inferno”). Sinon, played by Elliot Page, a transgender performer whose casting was the source of some controversy (first because he was incorrectly identified as playing Achilles and then because of the casting of a transgender as a Greek warrior). The question, however, is why Nolan chose to include Sinon at all. Nolan claims it is to reclaim the status of Sinon, a notorious traitor in “The Aeneid,” to shine a damning light on Odysseus’s own failings, and to expand Homer’s world to create a fuller mythological world. Despite these explanations, I still wonder “why?” I’m not convinced Homer needs support from Dante in creating a rich and fabulous world.
But the greatest concern many other critics and I have with Nolan’s “The Odyssey” is in the depiction of the central character, Odysseus. Homer’s brave, arrogant, resourceful, scheming, and sometimes cheeky warrior becomes, in political commentator and podcaster Matt Walsh’s view, “an anachronistic whiney, solemn shell of a man plagued by ‘trauma’ and ‘guilt.’” Scholar and translator Daniel Mendelsohn argued that the film’s Odysseus is simply another in the line of Nolan’s tortured characters (Oppenheimer comes to mind), haunted by their past. This Odysseus appears nowhere in Homer.
Related Stories

The Moral Framework of the Odyssey

A Review of a New Serialized ‘Odyssey’ Audiobook
Edith Hall, professor of classics and a leading authority on Greek drama and epics, criticized the depiction of Odysseus, saying that Nolan’s version “removes the dangerous edge that makes Odysseus Odysseus.” Interestingly, most commentators with these reservations about the film (except Walsh) found the structure and look of the film to be praiseworthy.
When I first saw the trailer for “The Odyssey,” I was excited to see the film, not because of Matt Damon or even Christopher Nolan, but because someone had bothered to film a seminal Western classic. I then started reading some of the legitimate criticisms and almost felt inclined to skip the film and wait for the DVD. Almost. I have come to the conclusion that, despite what I think are genuine flaws in the choices Nolan made, the film is still worth seeing for people who consider themselves traditionally minded or conservative. Here are my reasons:
- It’s not a terrible thing to have people talking about “The Odyssey.” Better they should be talking about a classic piece of Western literature than the umpteenth offering of the Marvel universe.
- If there’s one thing we need in contemporary America, it is true heroes. Despite his shortcomings, the Odysseus of Homer is a hero and not simply a battlefield hero. Nor is he the weak and emasculated Odysseus of Nolan’s film. Rather, he is the tested, cunning, long-suffering, and ultimately triumphant warrior who is driven by the love of and longing for his family. Seeing this film, especially as a family outing—it is rated “R” but there really is no gore or objectionable language—may make for great conversations on what a hero should be. My guess is that people will be innately more drawn to the classic hero than to the modern conception of the “hero,” whose flaws make him rather anti-heroic and therefore somehow human. We all need some superhuman traits to look up to sometimes. In any event, it makes for great conversation.
- We all know that, however faithful film adaptations try to be to their original sources—if they try at all—they always leave something out that enriches the book but cheapens the film. This is certainly the case with Nolan’s “The Odyssey,” as a number of Homer’s episodes are watered down or excluded from the film altogether. For example, the “Nobody” trick in the Cyclops episode is not included, although the Cyclops is. Perhaps the film will encourage others to read Homer’s poem or merely to learn more about it. There are even simple translations geared for children. We can use the film as a jumping-off point to a greater interest in Homer, ancient Greece, or the oft-attacked Western civilization, which has been beaten but not (yet) destroyed.
So rather than rejecting the film outright, perhaps we should see it, critique it, find things to praise about it—Nolan’s a good filmmaker, after all—and apply our sense of what is good, beautiful, and true to the film. Better still, perhaps the film will inspire creativity in conservative or traditionally minded people to take what’s wrong about “The Odyssey” and improve upon it.
Views expressed in this article are opinions of the author and do not necessarily reflect the views of The Epoch Times.