stock here: Dr. John Campbell did some analysis on Australia and UK Excess Deaths, he was in around 17%.
USA looks like minimum 20%. Wait for that data though, I still need to chart it. Funny there is not more data earlier than 2018. Sure is ODD
Chart below is for death numbers in USA, Monthly, 18 to 39 Age Range, I’ll use this is my future stab at what a population out years chart will tell. Death in this range alters “effective fertility” and thus birth rate.
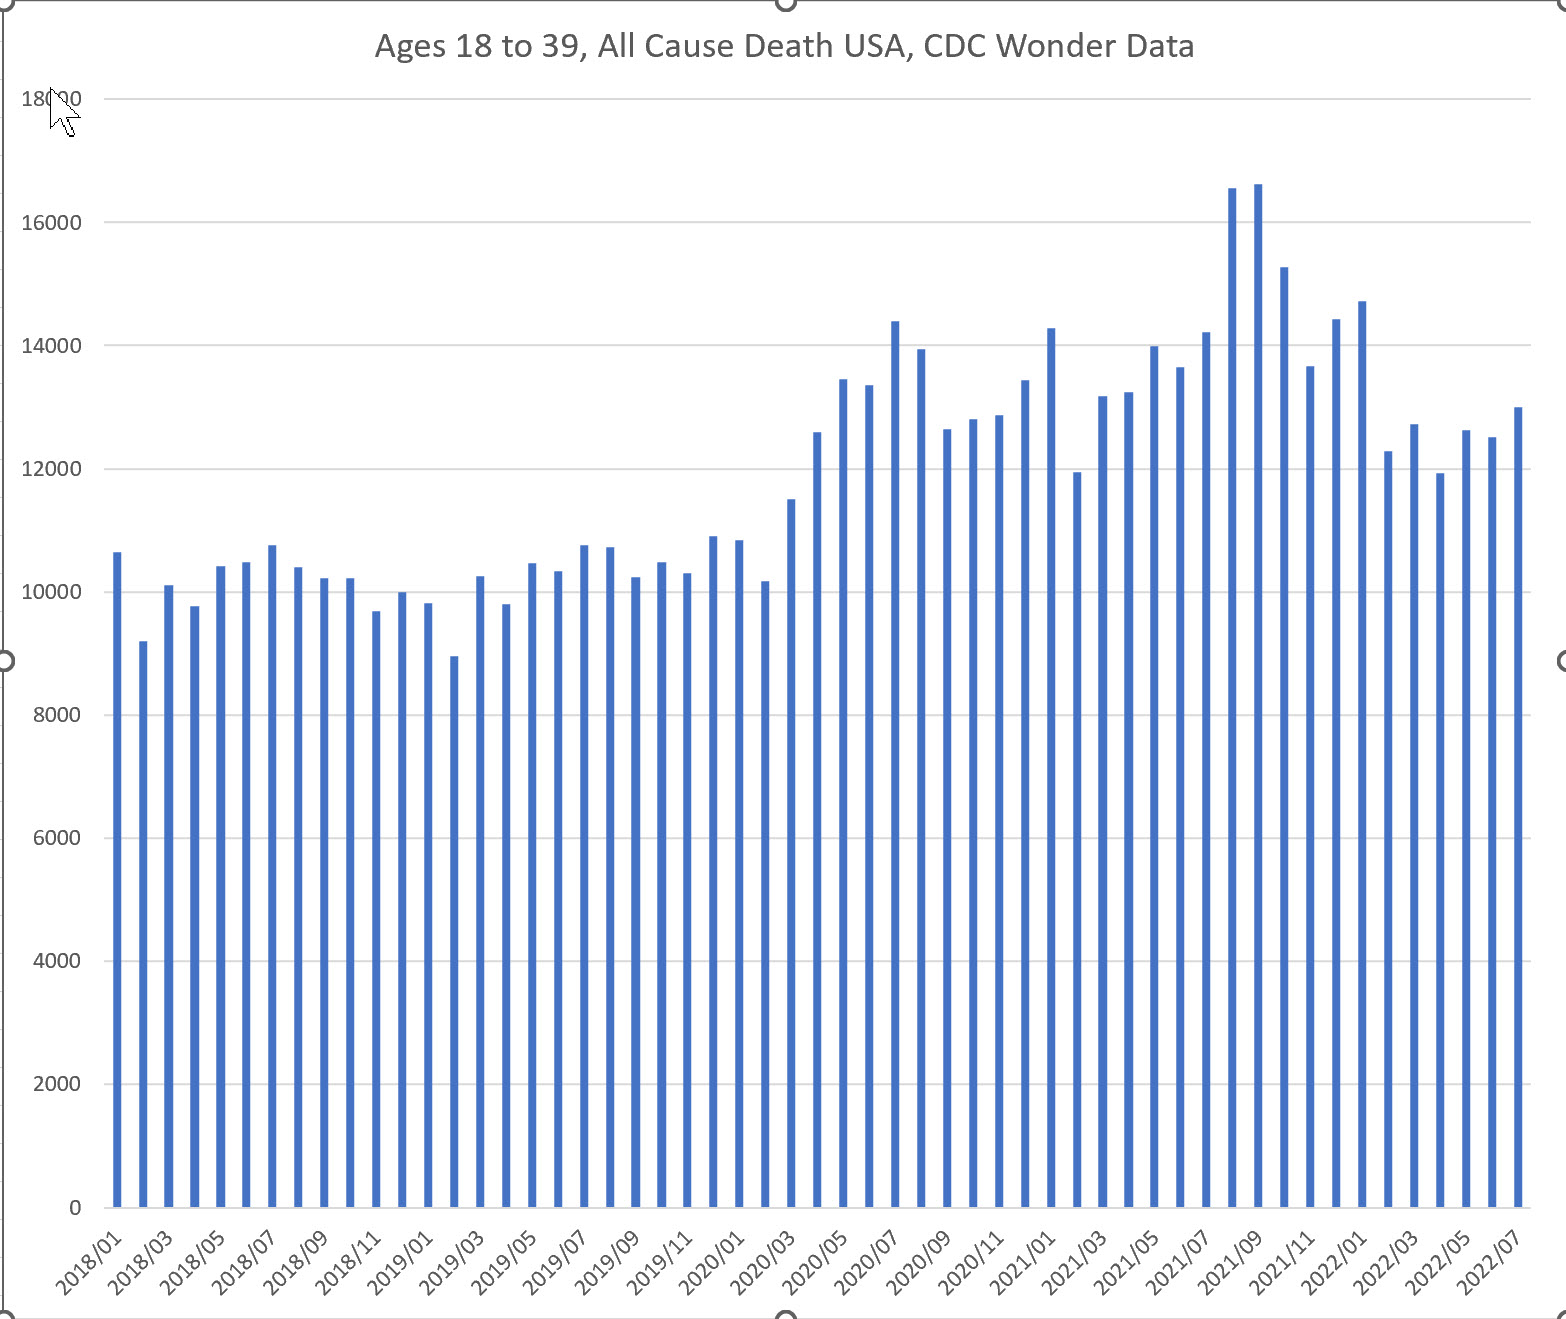
I also took about an hours to review the birth rate data. It was very difficult to deal with the data system, it took 4 tries.
https://wonder.cdc.gov/controller/datarequest/D149
Amazingly, they have ZERO data for 2021. Although certainly all the data is entered into computers in near real time. So that looks very intentional
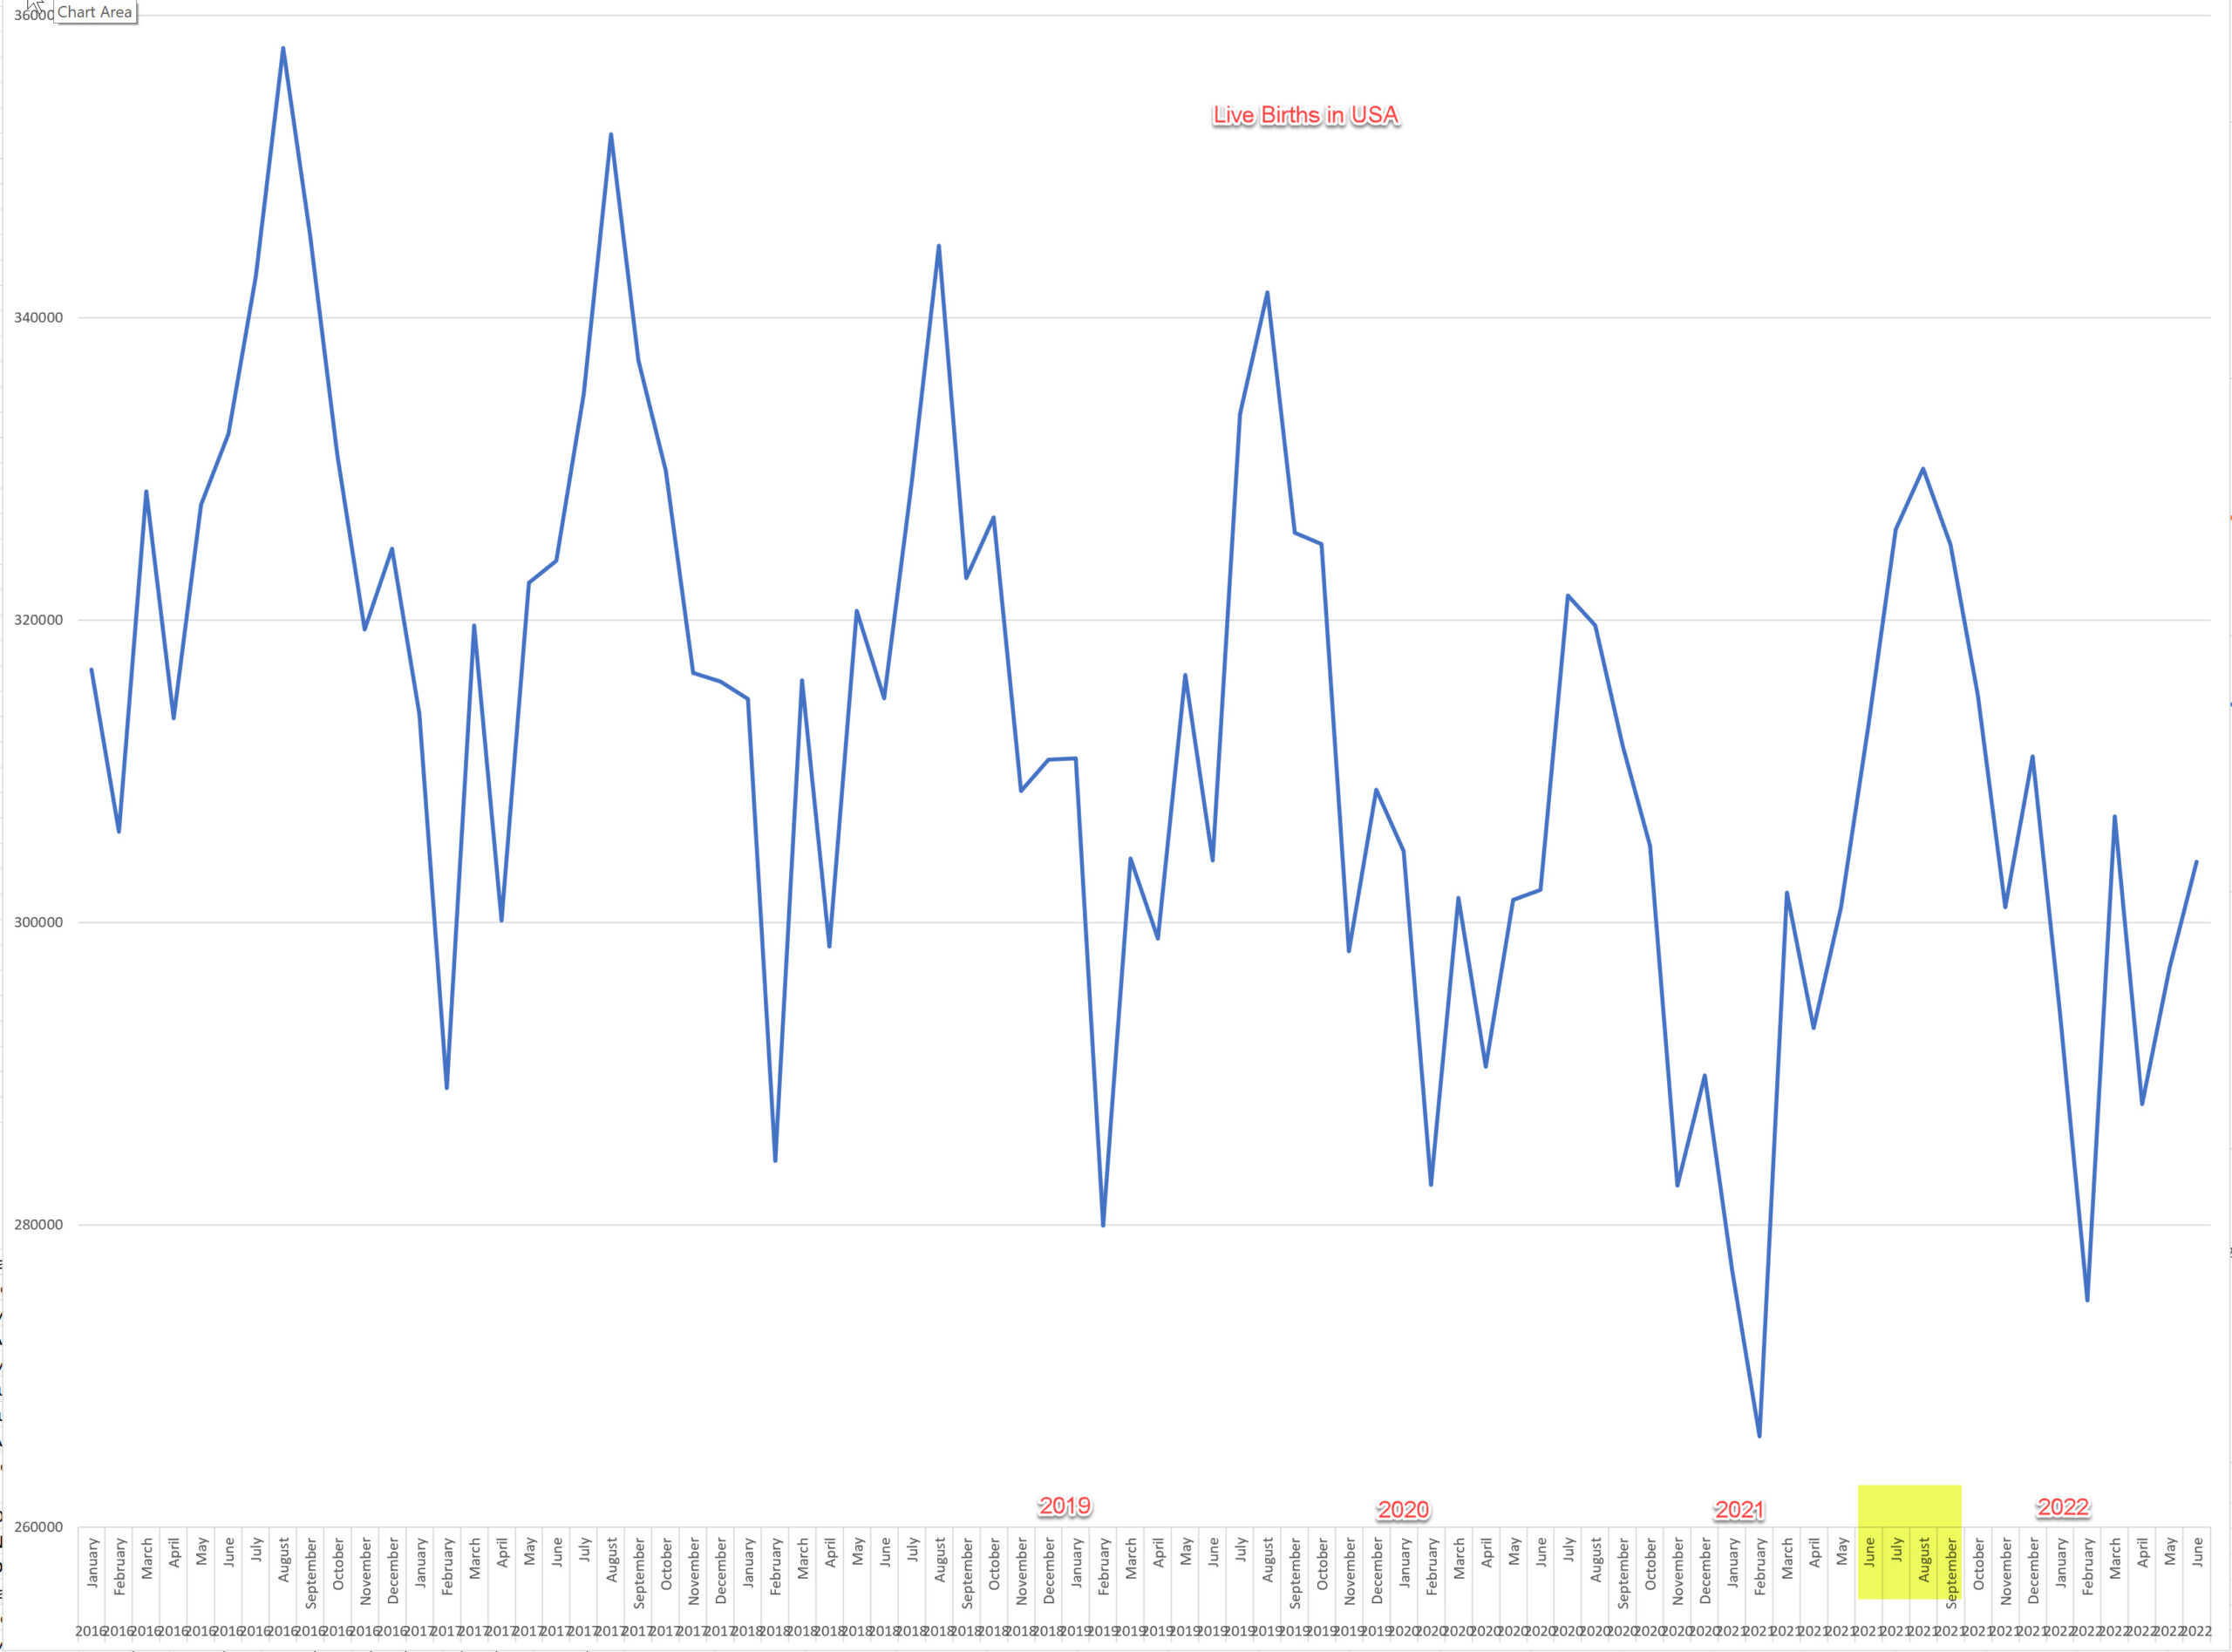
Looks like about an 8% drop in 5 years
But there is other data available
https://www.cdc.gov/nchs/nvss/vsrr/provisional-tables.htm
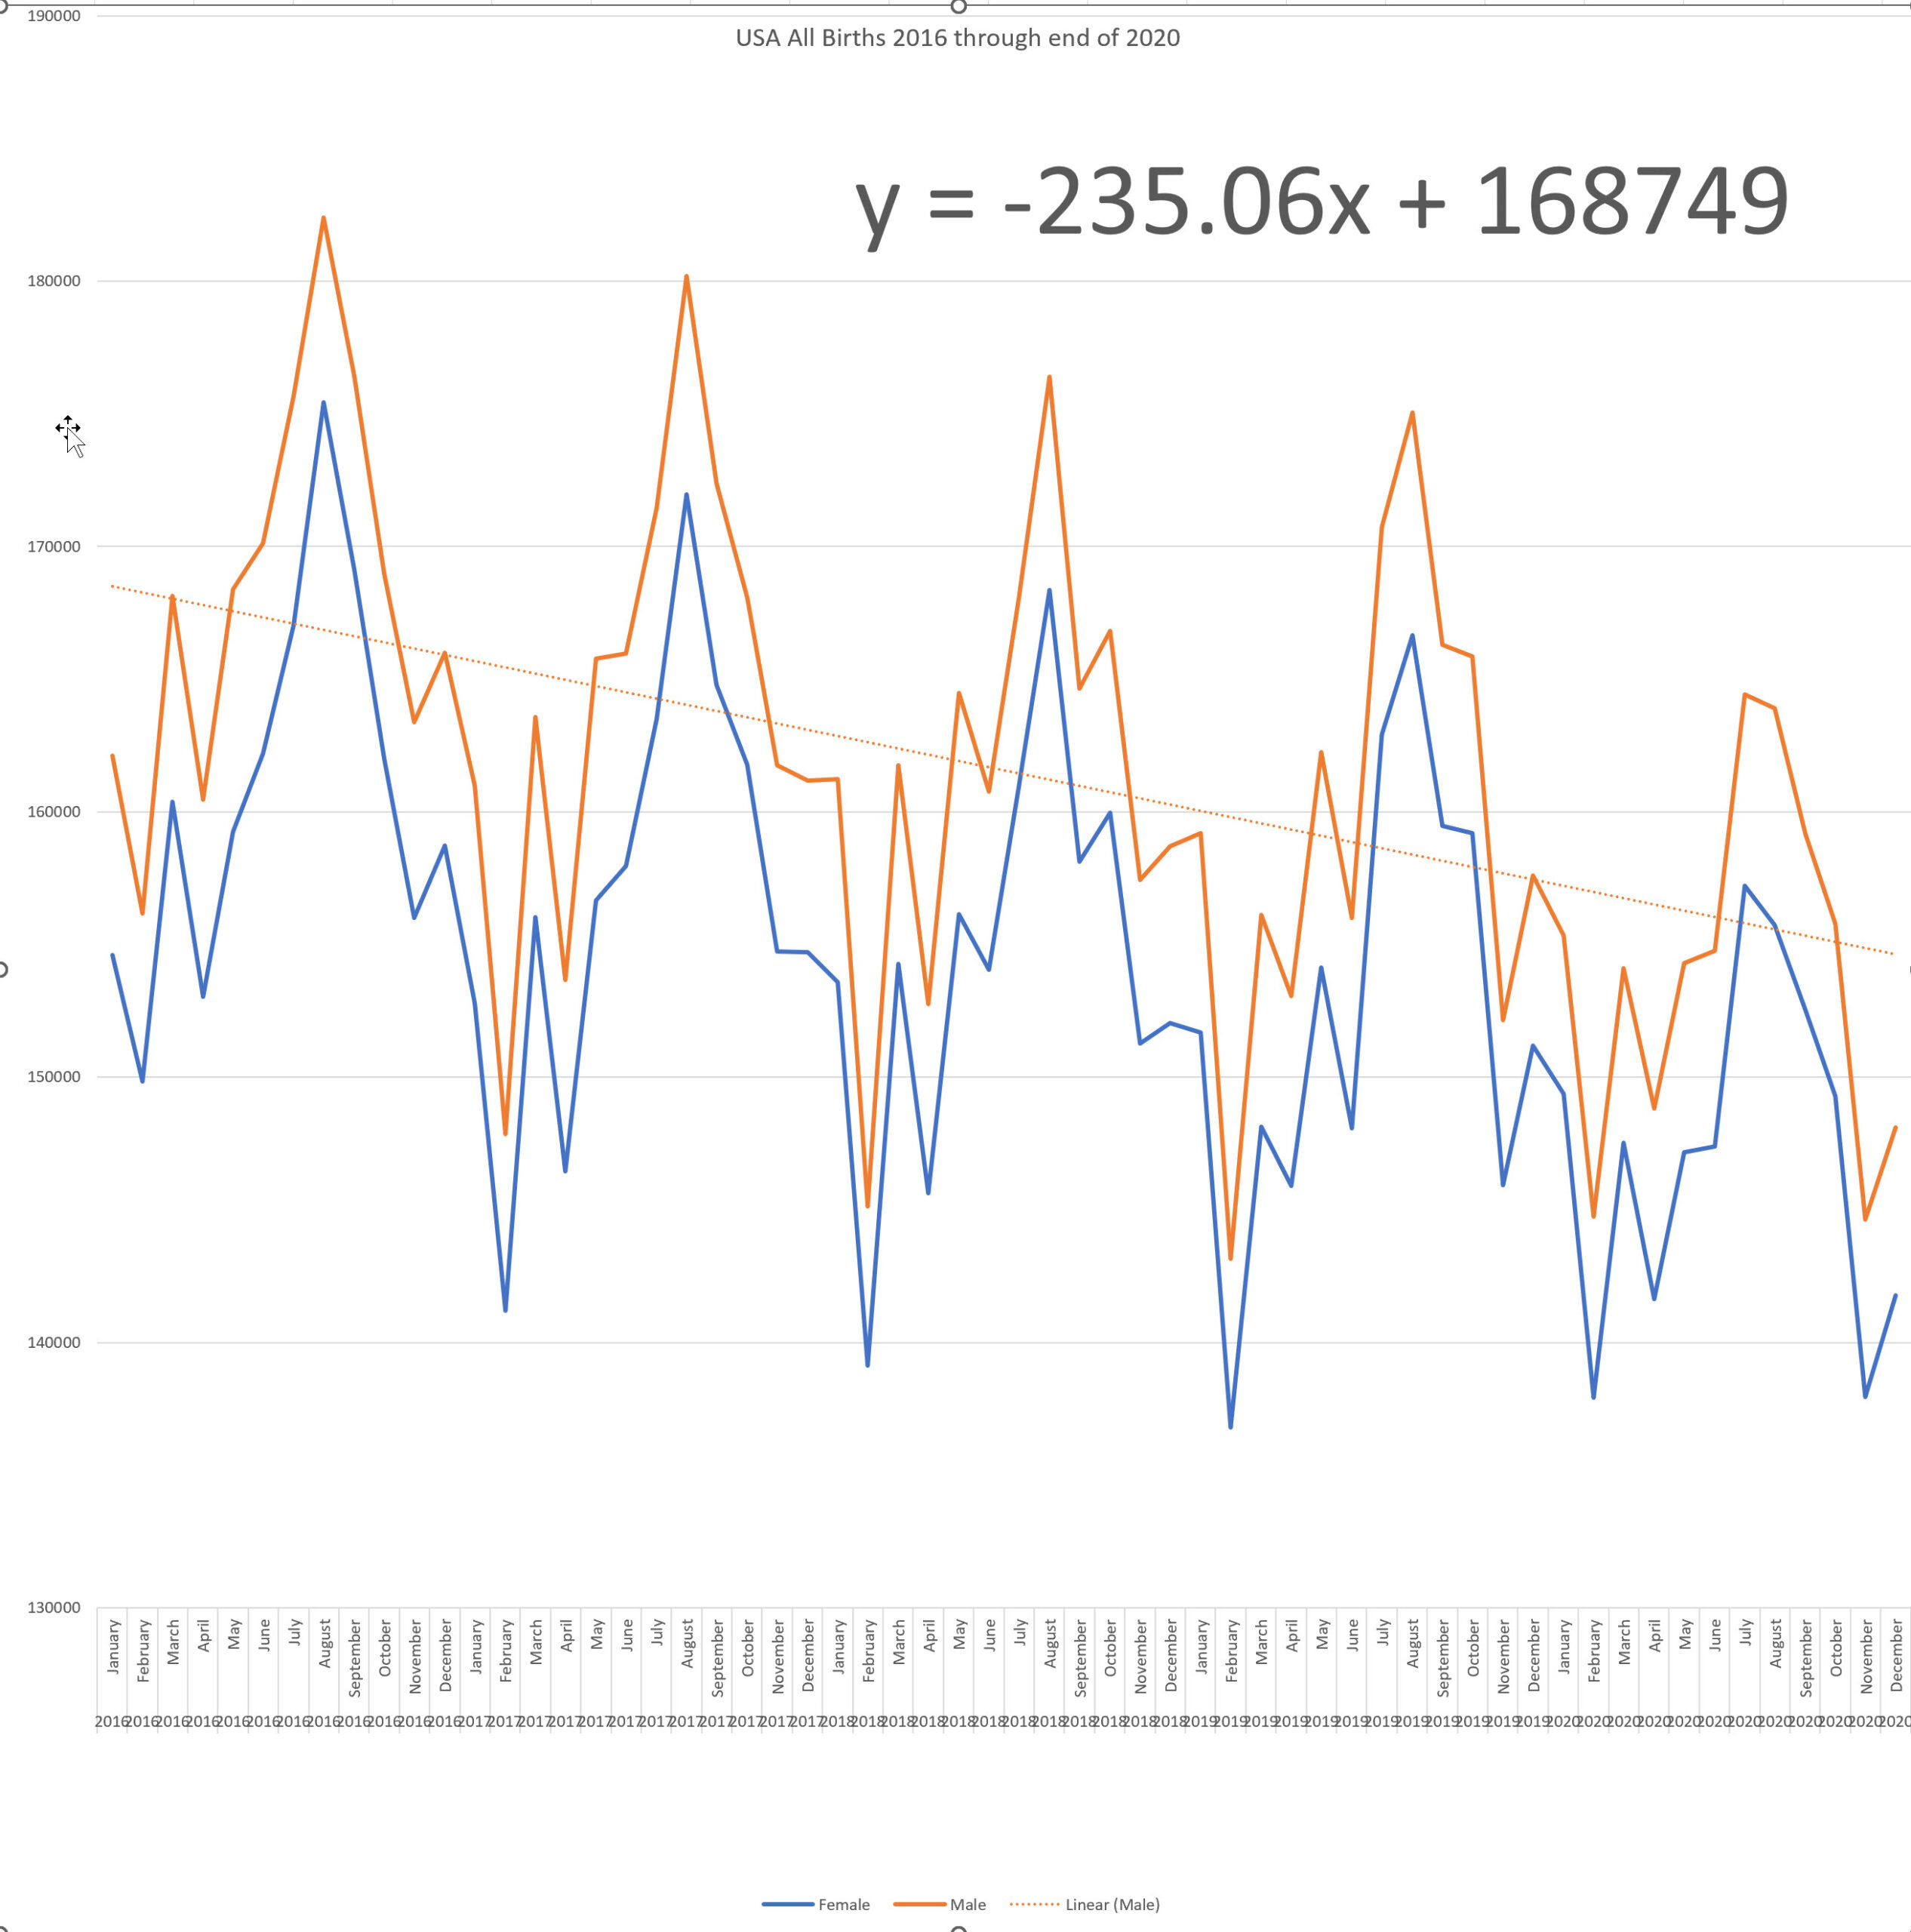
I made a combined chart, it is what it is.