Some elements of this post require adjustments. We now have good information direct from Pfizer that batches vary in size, but 180,000 is a good average.
stock here: seriously folks, I introduced this “fact” to the world in early Aug 2020, and then republished it in more snazzy fashion that got hits and spread. Within 6 hours, my Google account had been banned and all historical article lookup (spanning 10 years) had been obliterated. Over the target big time.
It took a while for anyone else to pick up on this, it took me weeks to somewhat restore my blog from a recent backup (I knew I was walking on eggshells and Google had thrown a few shots across my bow by “unpublishing” articles that I had published.)
Even now I am not happy with the formatting of my WordPress site, but we all should be busy preparing for whatever comes next. Keep in mind that no person works as hard as a slave who thinks they are “free”.
So here we go….a few sites are now publishing the “killer batches”. I jotted down a goal of comparing all of the batch numbers that have caused severe events, to all of the batch numbers that have caused reported deaths to VAERS. I am not exactly sure how to do that comparison in an automated way, maybe something to do with conditional formatting as a trick. I want to see if there are batches that are “known” from the smaller adverse events, that also have not had any reported death. I know of no other way to get a list of all of the batches, and not really in a position to go after my first FOIA request. But maybe someone could do that. The data table from the website at far bottom kind of does that but I would want it for ALL batches known.
Even the big writers like Berenson, Kirsch, and now Malone have not quite crossed the Rubicon, or they are afraid to admit it. The truth is just too horrible for most people to even admit it. So by going directly to the truth, the message would be immediately lost, so I will let them soft sell it for a while. Now the reports of 40% excess deaths in the 18 to 65 age bracket are coming out, and not do to COVID. Some will argue that they are caused by damage due to the lockdowns, and certainly there will be some.
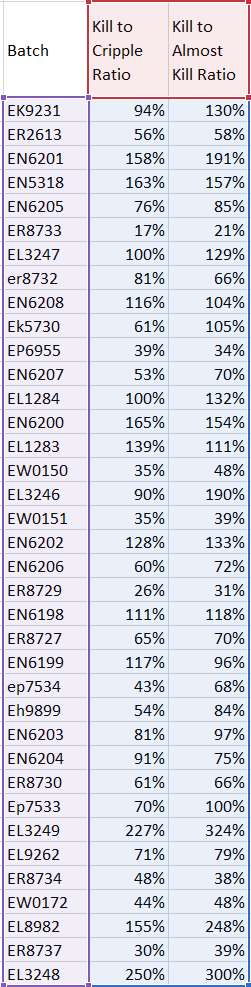
| BATCH | ADRs | DEATHS | DISABILITIES | LIFE THREATENING ILLNESSES |
| EK9231 | 3412 | 48 | 51 | 37 |
| ER2613 | 3143 | 29 | 52 | 50 |
| EN6201 | 2633 | 90 | 57 | 47 |
| EN5318 | 2604 | 80 | 49 | 51 |
| EN6205 | 2582 | 41 | 54 | 48 |
| ER8733 | 2549 | 9 | 54 | 43 |
| EL3247 | 2516 | 31 | 31 | 24 |
| er8732 | 2492 | 35 | 43 | 53 |
| EN6208 | 2488 | 51 | 44 | 49 |
| Ek5730 | 2487 | 22 | 36 | 21 |
| EP6955 | 2435 | 18 | 46 | 53 |
| EN6207 | 2369 | 33 | 62 | 47 |
| EL1284 | 2361 | 33 | 33 | 25 |
| EN6200 | 2290 | 71 | 43 | 46 |
| EL1283 | 2249 | 50 | 36 | 45 |
| EW0150 | 2230 | 16 | 46 | 33 |
| EL3246 | 2222 | 38 | 42 | 20 |
| EW0151 | 2218 | 13 | 37 | 33 |
| EN6202 | 2209 | 64 | 50 | 48 |
| EN6206 | 2190 | 28 | 47 | 39 |
| ER8729 | 2184 | 10 | 38 | 32 |
| EN6198 | 2182 | 60 | 54 | 51 |
| ER8727 | 2121 | 28 | 43 | 40 |
| EN6199 | 2110 | 48 | 41 | 50 |
| ep7534 | 2064 | 26 | 60 | 38 |
| Eh9899 | 2052 | 21 | 39 | 25 |
| EN6203 | 2039 | 34 | 42 | 35 |
| EN6204 | 2029 | 41 | 45 | 55 |
| ER8730 | 1983 | 23 | 38 | 35 |
| Ep7533 | 1973 | 31 | 44 | 31 |
| EL3249 | 1972 | 68 | 30 | 21 |
| EL9262 | 1946 | 30 | 42 | 38 |
| ER8734 | 1944 | 15 | 31 | 39 |
| EW0172 | 1930 | 14 | 32 | 29 |
| EL8982 | 1923 | 62 | 40 | 25 |
| ER8737 | 1920 | 14 | 47 | 36 |
| EL3248 | 1912 | 75 | 30 | 25 |
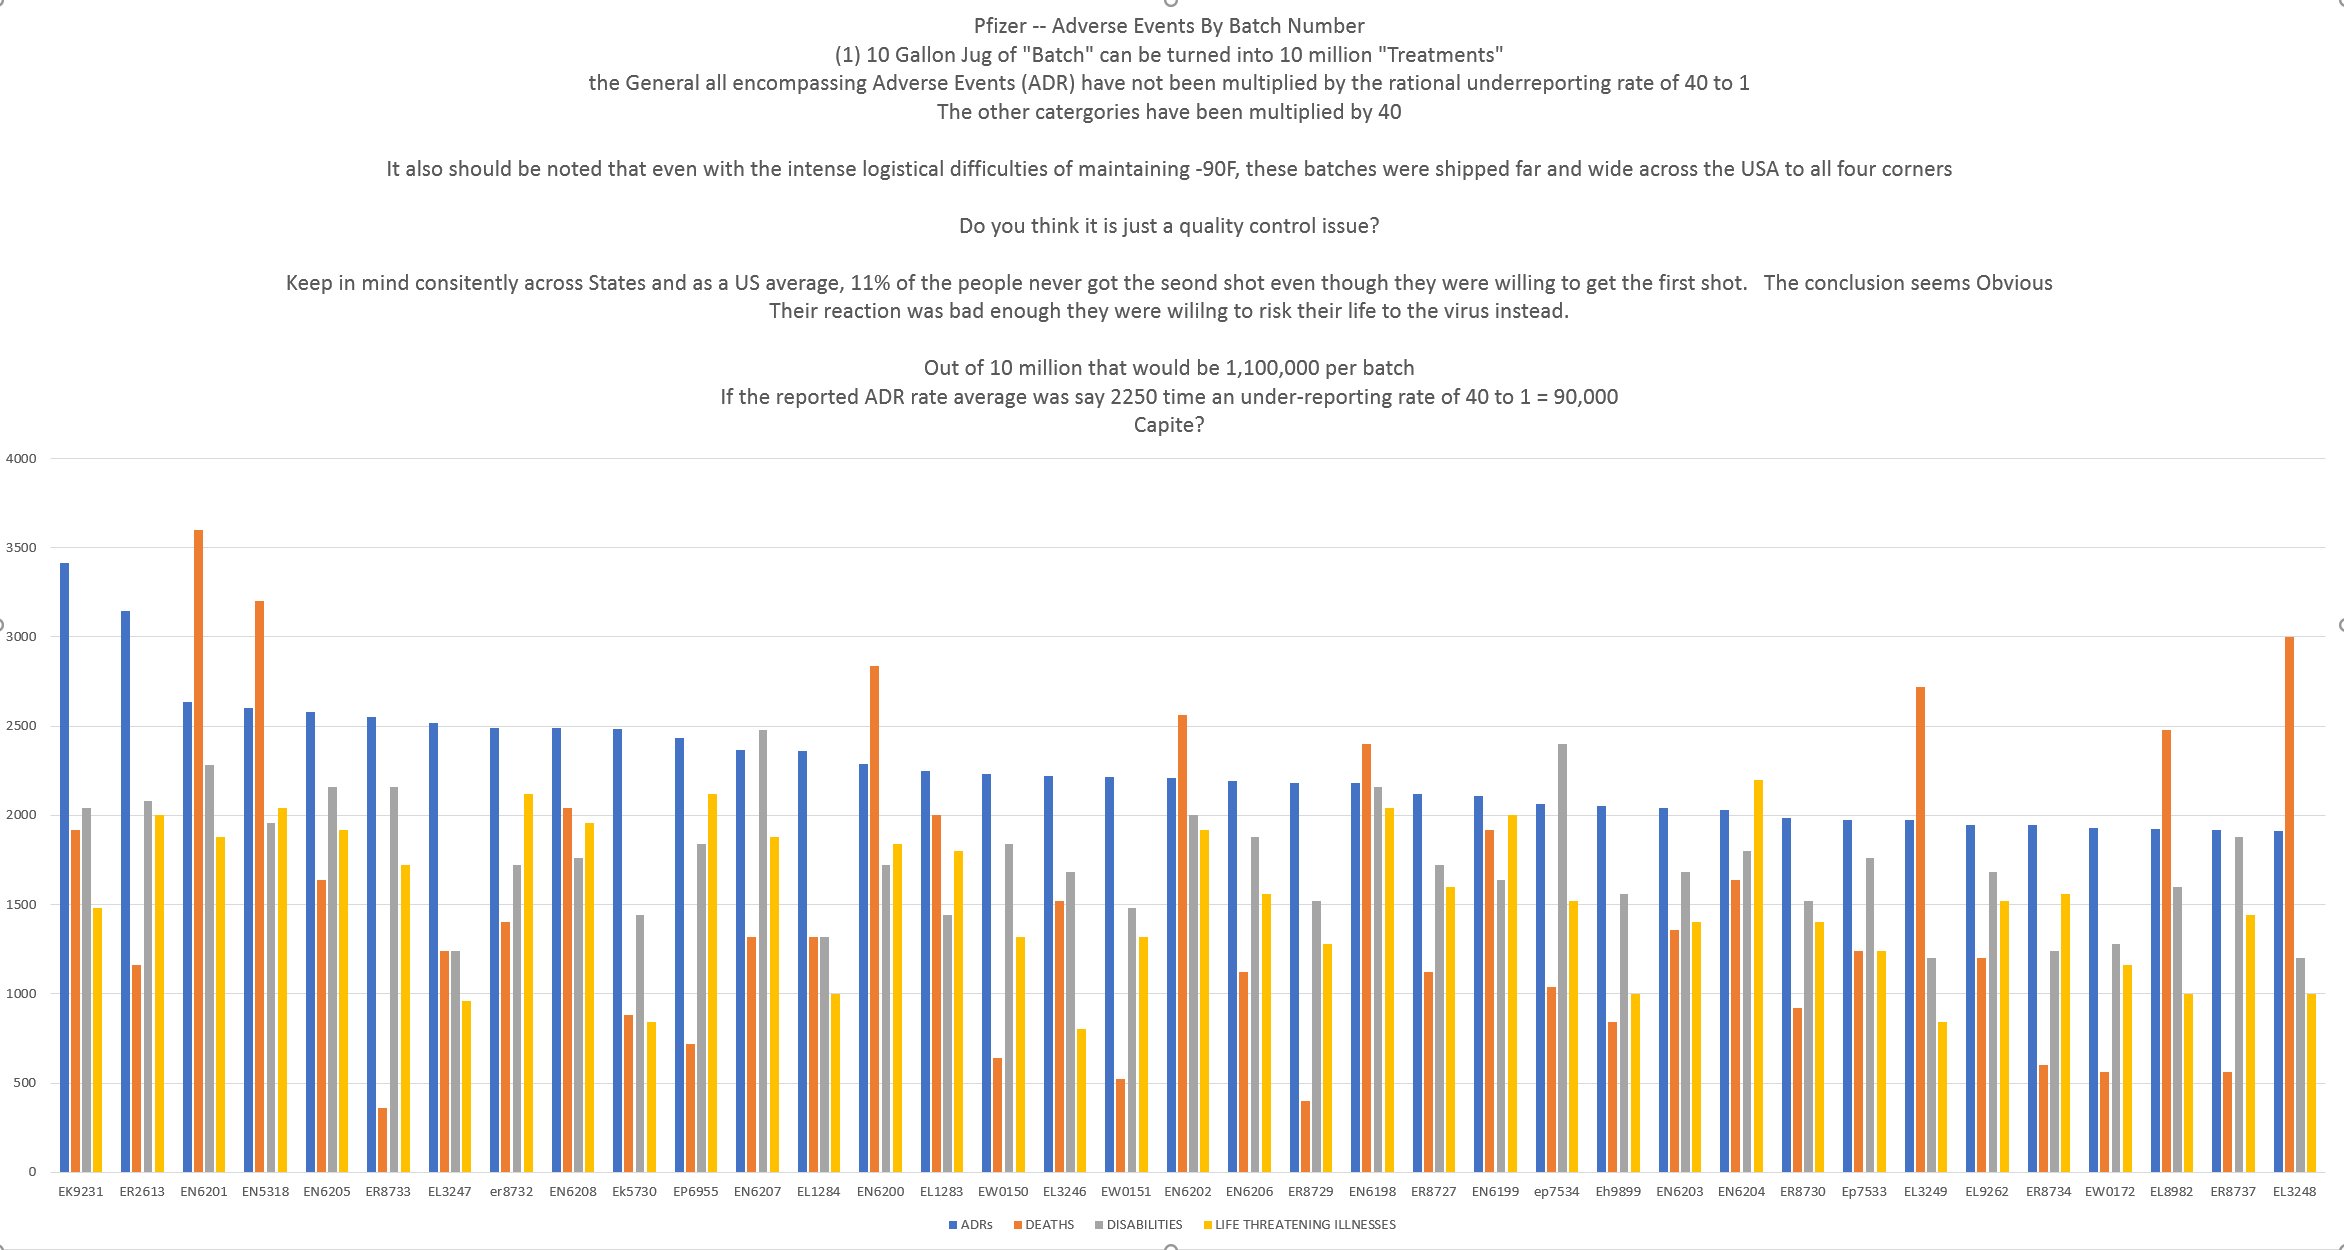
Pfizer — Adverse Events By Batch Number
(1) 10 Gallon Jug of “Batch” can be turned into 10 million “Treatments”
the General all encompassing Adverse Events (ADR) have not been multiplied by the rational under-reporting rate of 40 to 1
The other categories have been multiplied by 40
It also should be noted that even with the intense logistical difficulties of maintaining -90F, these batches were shipped far and wide across the USA to all four corners
Do you think it is just a quality control issue?
Keep in mind consitently across States and as a US average, 11% of the people never got the seond shot even though they were willing to get the first shot. The conclusion seems Obvious
Their reaction was bad enough they were willing to risk their life to the virus instead.
Out of a Batch of 180,000, there would be 18,180 who would not get the second Jab.
For the really bad batches let eye ball the adverse events reported was say 2250. An under-reporting rate of 40 to 1 seems reasonable = 90,000 or about HALF of those with the horrible batches had a really bad reaction.
Let’s “eyeball” the average deaths for the worst batches at 40, times 40 reporting rate = 1600. Equals .88888888888888% Quick Kill Rate.
Capite?