stock here: of course A-Eye doesn’t agree with my assessment “there is no evidence” except the obvious. I’ll put some A-Eye definitions of Inverted Yield Curve below, but bottom lines:
1) This most accurate predictor of recessions may be losing it’s power due to — Gold, Crypto, weird bond market, who knows.
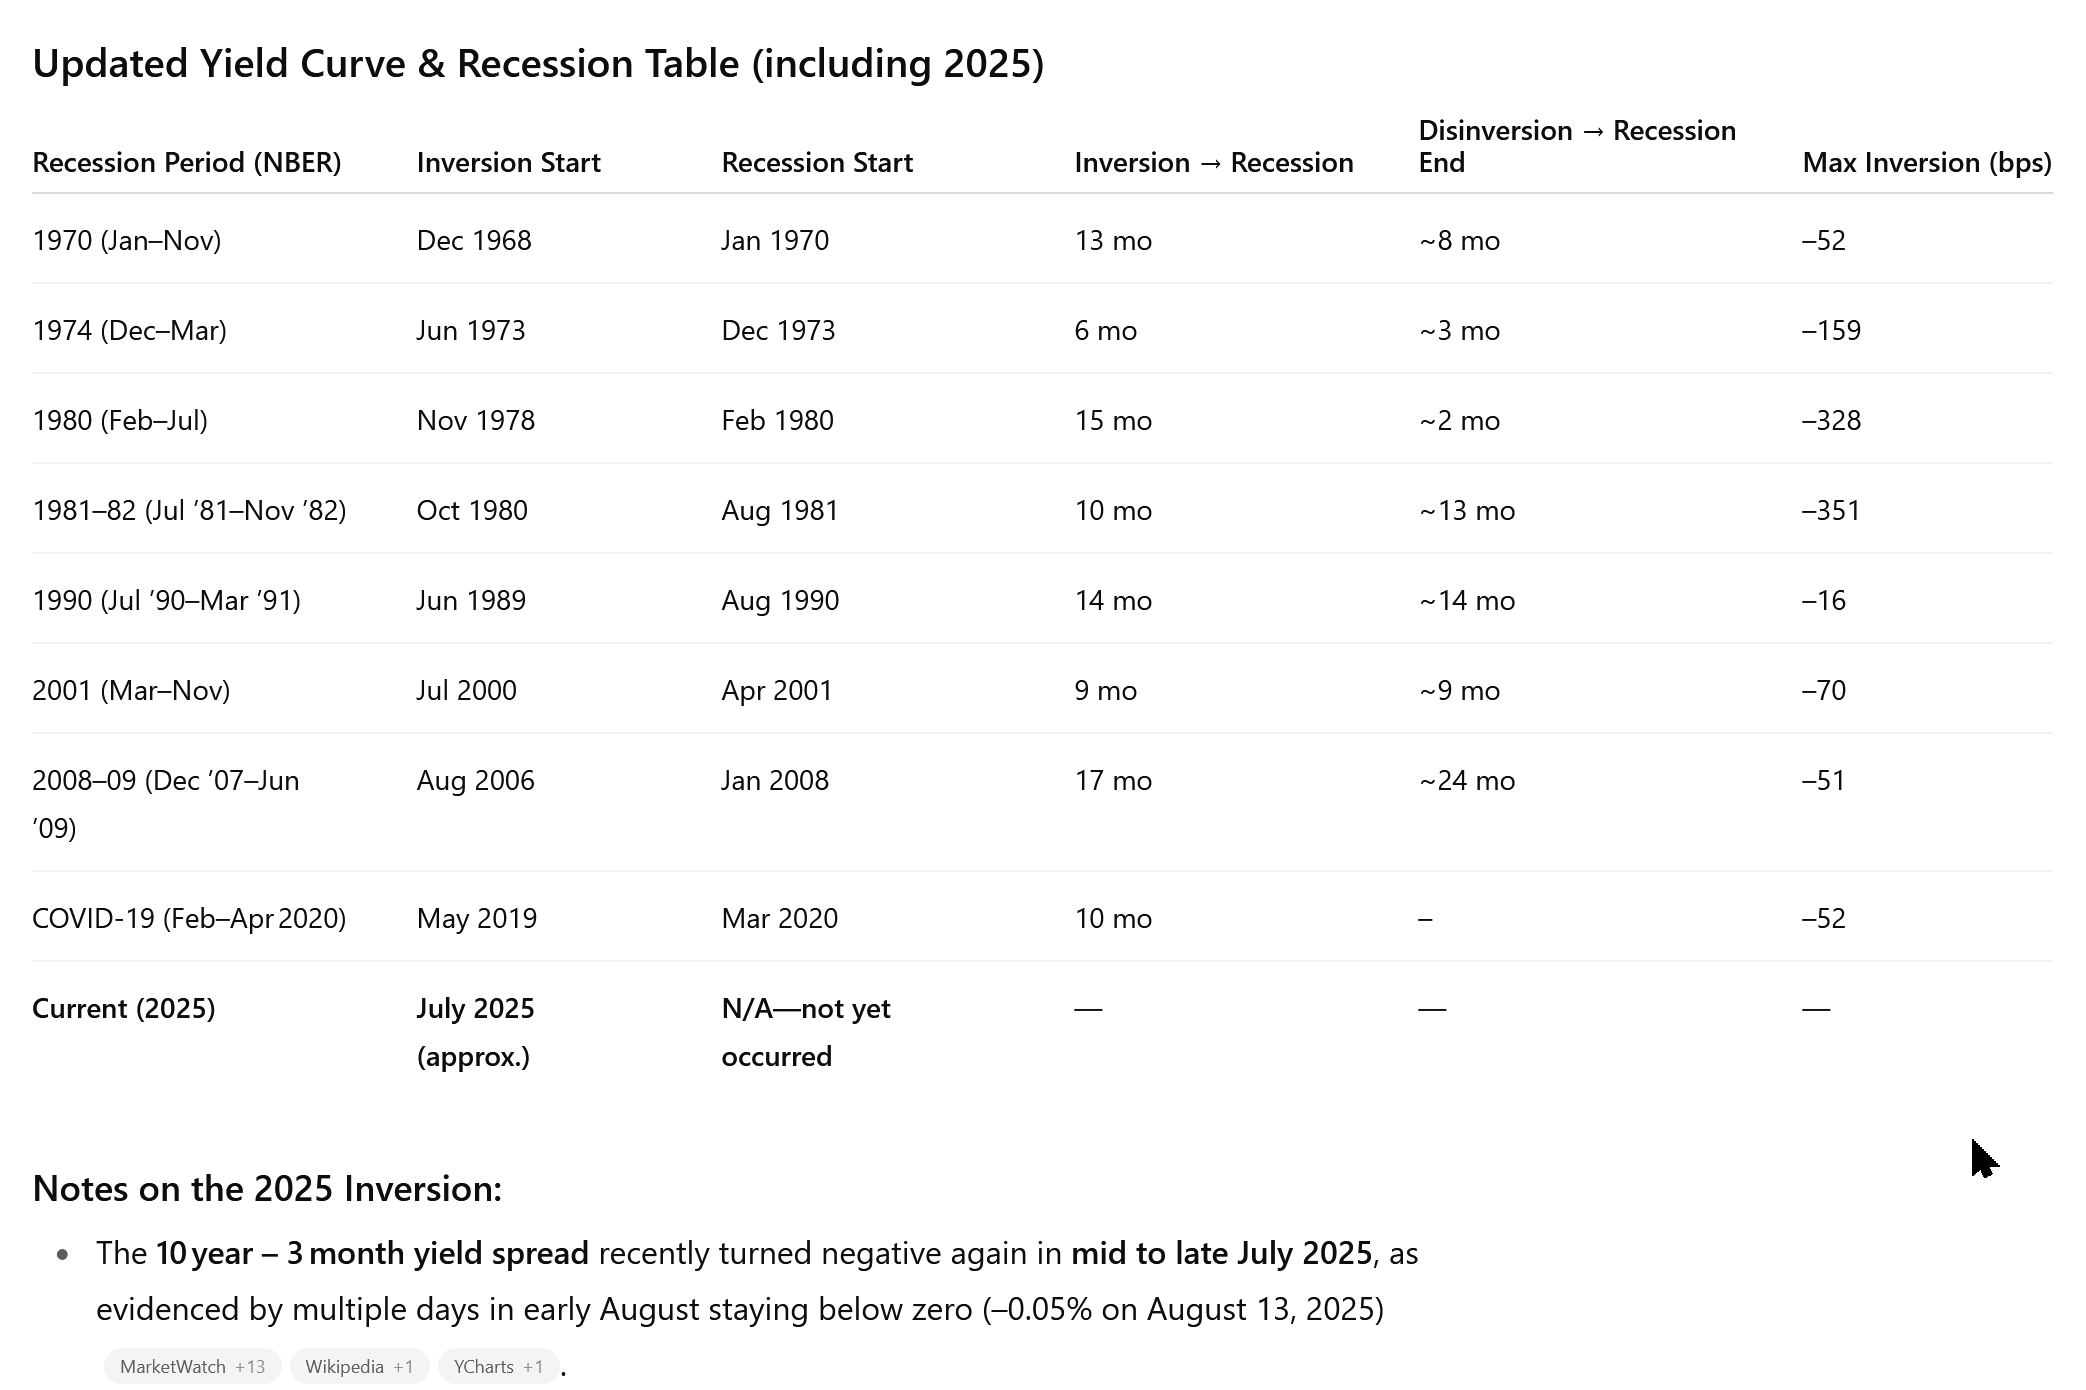
2) Every inversion and recovery has come with a recession, the second last one was a full 24 months.
Cutting rates early and consistently, LIKE EVERY OTHER COUNTRY IN THE WORLD, is the most likely way to avoid or mitigate a recession now. Powell wants to cripple Trump and our Nation. He should be fired immediately, not just sued for construction overruns on the new “Treasury” for private bankers funded by the US citizens.
Here’s the cleanest way to see it—and what history actually says about the “crossing back over.”
The charts you want
- 10-year minus 3-month Treasury spread (with recessions shaded) — the Fed’s preferred recession gauge (click “Fullscreen” on the page to explore history back to the 1950s). FRED
- Cleveland Fed’s yield-curve dashboard — live chart of the slope, its GDP growth signal, and the model-implied 12-month recession probability. Federal Reserve Bank of Cleveland
What “inversion” vs. “crossing back over” means
- Inversion: short rates (e.g., 3-month T-bill) exceed long rates (e.g., 10-year).
- Since 1955, every U.S. recession has been preceded by an inversion; there are a couple of noted “near-miss”/false signals in the 1960s. Federal Reserve Bank of San Francisco
- Crossing back over (disinversion / re-steepening): the spread turns back positive after being negative. Historically that tends to happen when the Fed starts cutting and short rates fall quickly—a “bull steepening.” Reuters
Does the cross-back “invariably” lead to recession? And how fast?
- A widely cited historical takeaway (summarized by Reuters using Bianco Research’s work) is:
- Average time from first inversion → recession: ~334 days.
- Average time from disinversion (crossing back over) → recession: ~66 days.
- Mechanism: the curve typically disinverts when the Fed cuts in response to stress; recessions have followed shortly after in the post-1960 record. Reuters
- The Cleveland Fed and SF Fed back up the broader point that the 10y–3m spread is the most reliable slope to watch for recession risk and that inversions have an excellent long-run track record as a lead signal. Federal Reserve Bank of ClevelandFederal Reserve Bank of San Francisco
Important nuance (so you’re not over-promised by any single indicator)
- Fed researchers emphasize correlation ≠ causation, and structural changes (term premia/QE/global flows) can affect timing. Still, across decades, the 10y–3m curve remains the best single-variable harbinger. Federal Reserve Bank of San Francisco
- Media/Street recaps sometimes say “every disinversion has led to recession.” The spirit of that rule is correct for the modern era because disinversions usually occur as policy eases into a slowdown—but it’s best framed as a very short fuse once the curve meaningfully re-steepens via falling short rates, not as a law of nature. Reuters
Quick takeaway you can trade around
- Watch the 10y–3m spread (FRED link above). When it’s inverted, recession odds 6–18 months out rise. FREDFederal Reserve Bank of San Francisco
- If/when the curve crosses back above zero because T-bill yields are dropping (policy cuts / stress), the historical fuse has been ~2 months on average to NBER recession. Reuters