stock here, note the A-Eye assist
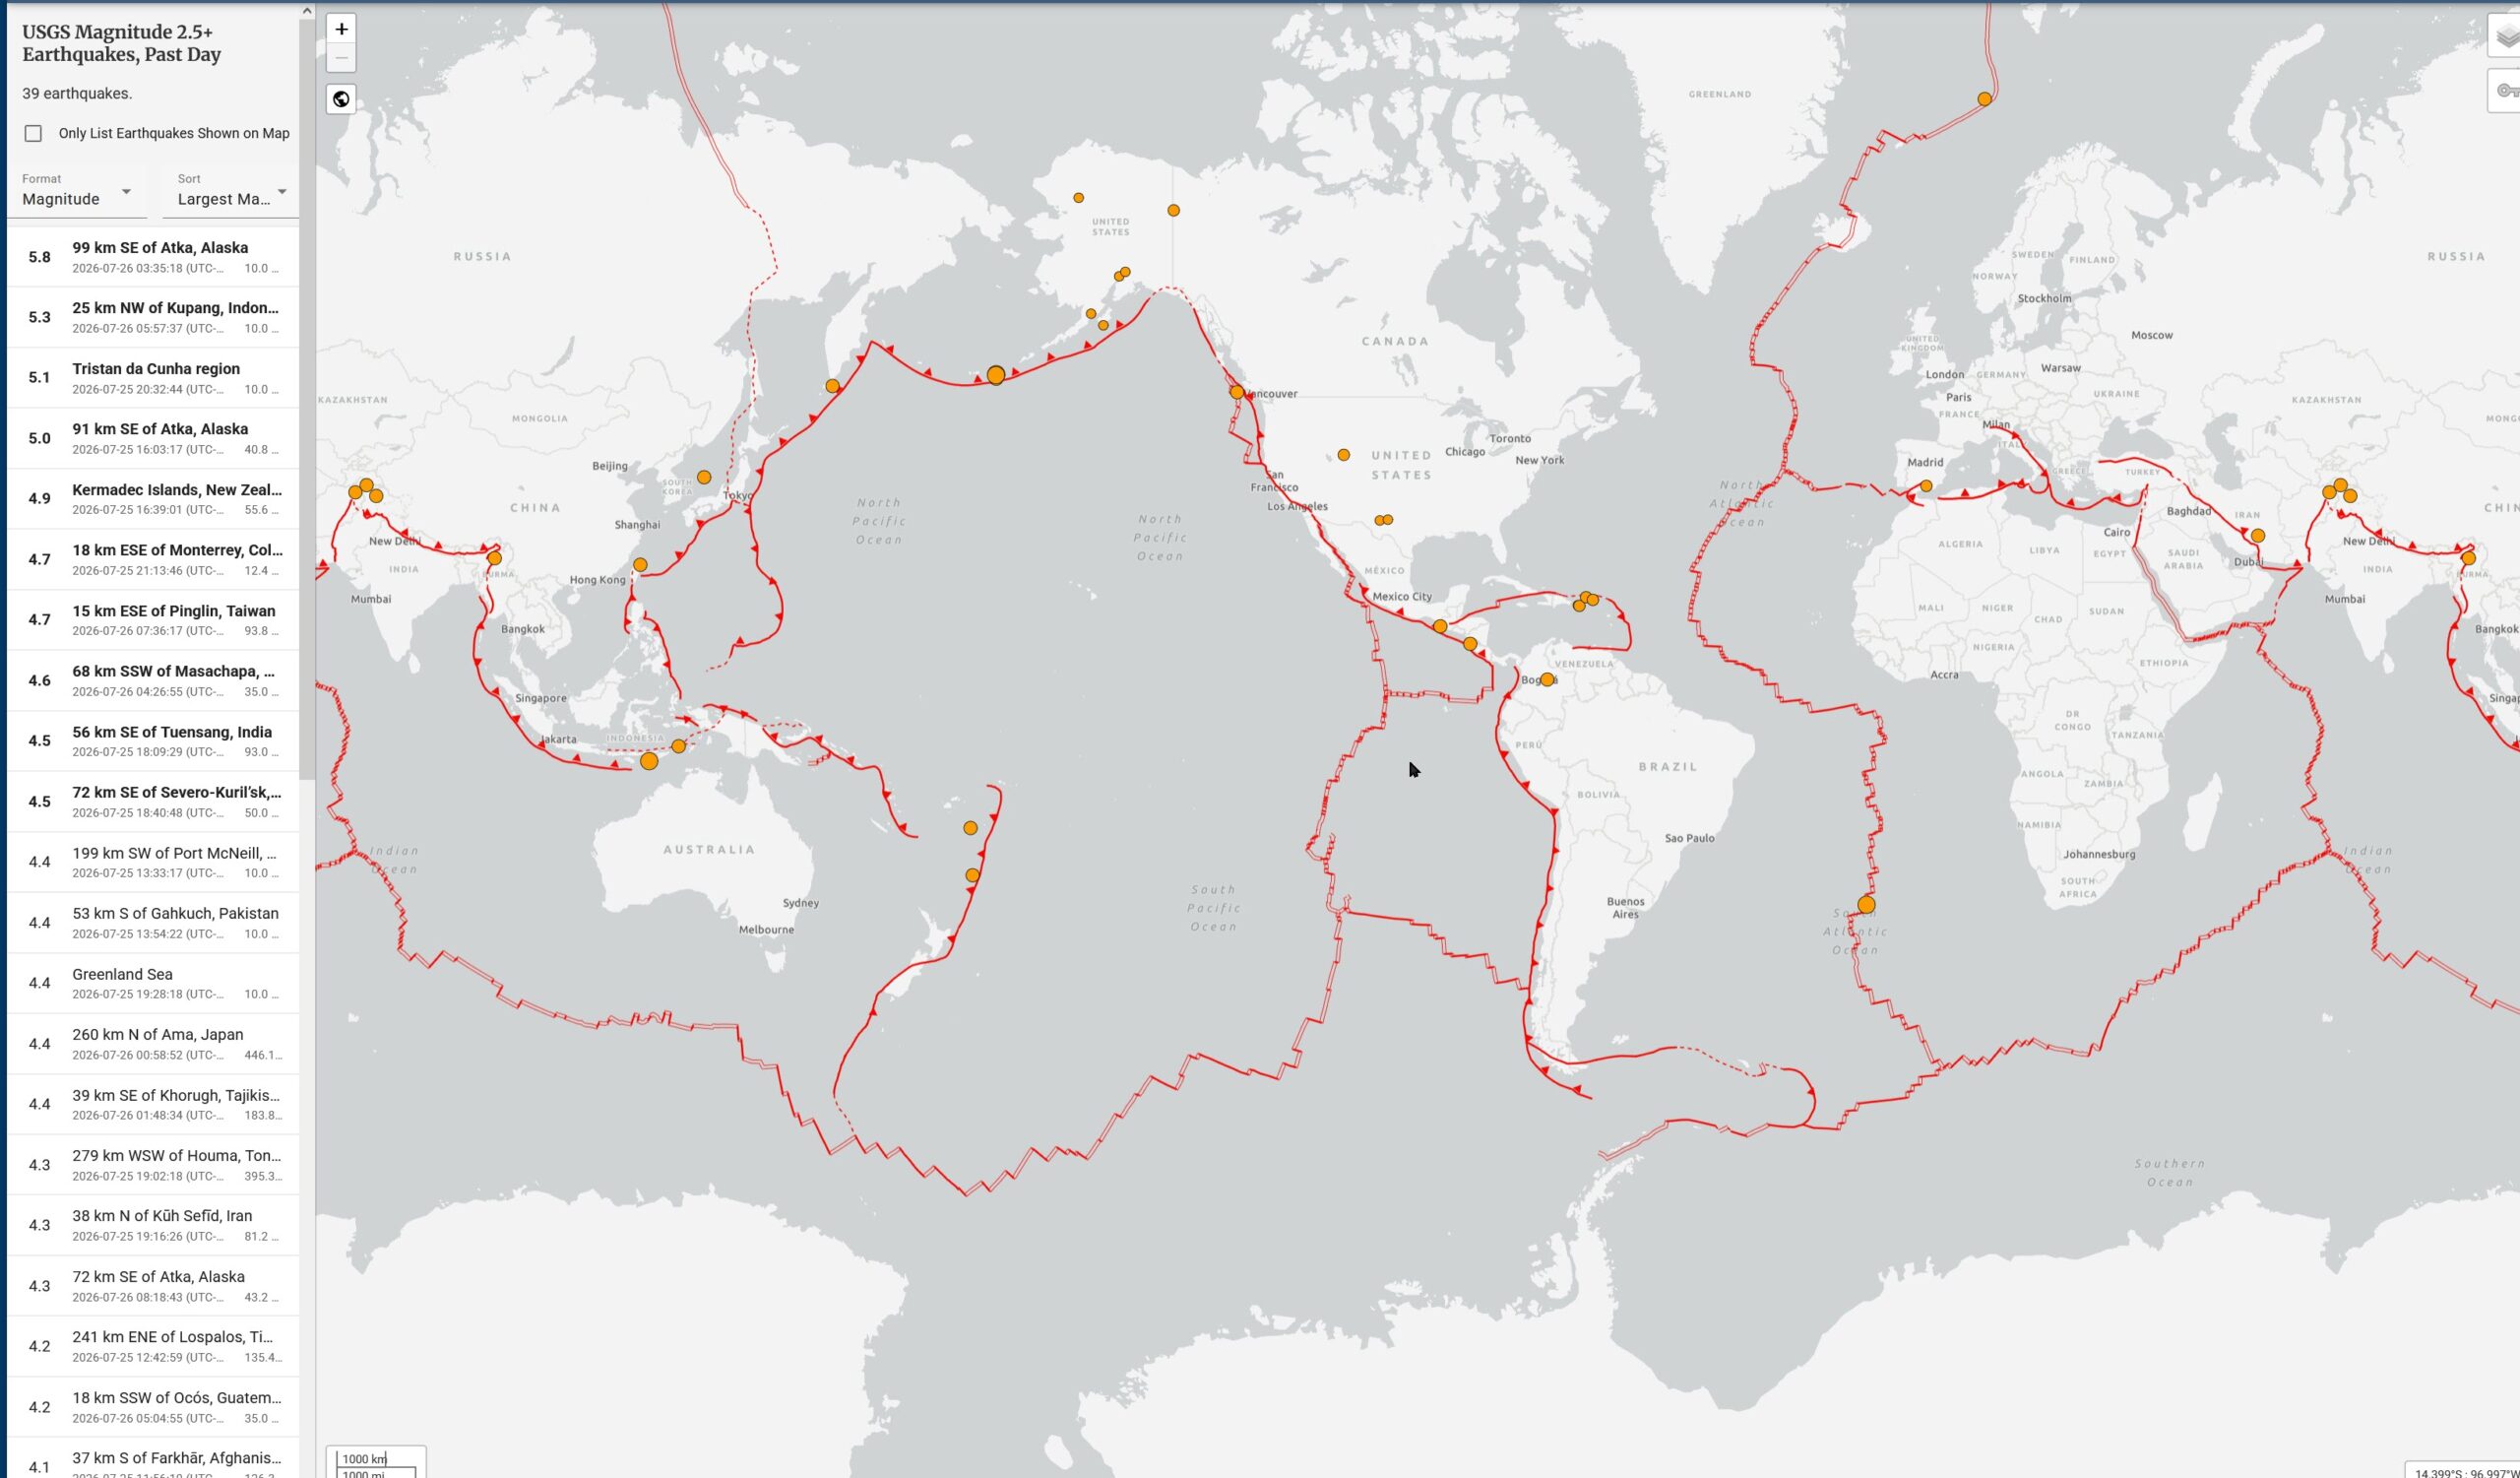
Those red lines are tectonic plate boundaries, not a worldwide map of every individual fault. USGS has changed the layer so the boundary type is encoded directly into the linework. The underlying USGS service classifies them as convergent, divergent, transform, “other,” plus microplate boundaries.
How to read the new symbols
Red line with triangular teeth — convergent/subduction boundary
One plate is moving beneath another. The teeth are drawn on the overriding-plate side, and they point generally in the direction the descending slab dips.
Examples in your screenshot:
- Aleutian chain: Pacific Plate subducting northward beneath the North American Plate.
- West coast of South America: Nazca Plate subducting eastward beneath South America.
- Japan–Kuril–Kamchatka: Pacific Plate subducting beneath the plates to the west.
- Indonesia: Indian-Australian oceanic crust subducting beneath the Sunda region.
These are the boundaries capable of producing the largest megathrust earthquakes and major tsunamis.
Red line with short marks extending to both sides — divergent boundary
The plates are separating and new oceanic crust is being created. These are spreading ridges.
Examples:
- Mid-Atlantic Ridge.
- East Pacific Rise.
- Indian Ocean ridge system.
- Pacific–Antarctic Ridge.
Earthquakes here are generally shallow and usually smaller than major subduction earthquakes.
Plain red line — transform boundary
The plates slide horizontally past one another. No crust is primarily created or destroyed.
Examples:
- San Andreas system in California.
- Alpine Fault in New Zealand.
- Northern Caribbean boundary.
- Dead Sea Transform.
These can generate severe shallow earthquakes, but ordinarily not the giant megathrust-tsunami combination associated with subduction zones.
Dashed or very fine red lines — secondary, diffuse, uncertain, or microplate boundaries
The USGS data now includes a separate microplates layer in addition to the major plates. Some faint or broken-looking boundaries are therefore:
- boundaries of smaller tectonic blocks,
- broad deformation zones rather than one clean fault,
- less precisely defined boundary segments,
- or lines rendered very thinly at the global zoom level.
“Other” boundary
USGS also has an explicit “Other” classification for boundaries that do not fit neatly into pure convergent, divergent, or transform motion—often because the tectonics are complicated, oblique, or distributed across several faults.
The earthquake dots
The orange circles are earthquakes occurring during the past day under your selected magnitude threshold of M2.5+. USGS uses orange for events during the past day, with circle size corresponding approximately to magnitude.
The striking takeaway from your screenshot is that most earthquakes track the plate boundaries, especially the Pacific “Ring of Fire,” but some occur inside plates. USGS notes that intraplate earthquakes can occur on older faults and zones of crustal weakness even far from a modern plate edge.
So, in plain English:
- Teeth = one plate diving under another
- Cross-marked/double-sided line = plates pulling apart
- Plain line = plates sliding sideways
- Fine/dashed line = microplate, diffuse, or less-defined boundary
And the teeth do not show where an earthquake is presently moving—they describe the long-term geometry of the plate boundary.